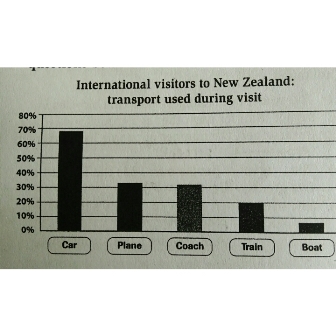
Analisys of the chart - transport used by visitors during travel in New Zealand
The chart shows the vehicles used by visitors during travel in New Zealand. The most popular transport is using car which the percentage is almost 70 percent. Plane and coach are the next favourite vehicles which have nearly same amount that are around 30 percent. The percentage of holidaymakers using train is 20 percent and least of all is using boat, with the percentage is 5 percent. For the conclusion, public transportation is more popular than private vehicle which the total is more than 85 percent of visitors.

PhotoGrid_1471106505.jpg
Hi Ashela..
Welcome to Essay Forum.
I will give you the alternative sentences. You can learn it so that your writing does not seem rigid.
The chart shows the vehicles used by visitors during travel in New Zealand INTERNATIONAL TOURISTS HAVE A TENDENCY TO DRIVE THE CAR WHEN THEY CONDUCT A TRIP TO NEW ZEALAND, REPRESENTING AT APPROXIMATELY 70% OF TOTAL. The most popular transport is using car which the percentage is almost 70 percent. MEANWHILE, Plane and coach are the next favourite vehicles which have nearly THE SAME POSITION LESS THAN A HALF AS MUCH .
... 20 percent and least of all is using THE boat, with the percentage is 5 percent.
Note: You have to have the bravery to compare amongst the figures if you wanna reach the higher score.
| Home / Writing Feedback / Analisys of the chart - transport used by visitors during travel in New Zealand |
ⓘ Need academic writing help? 100% custom and human!

