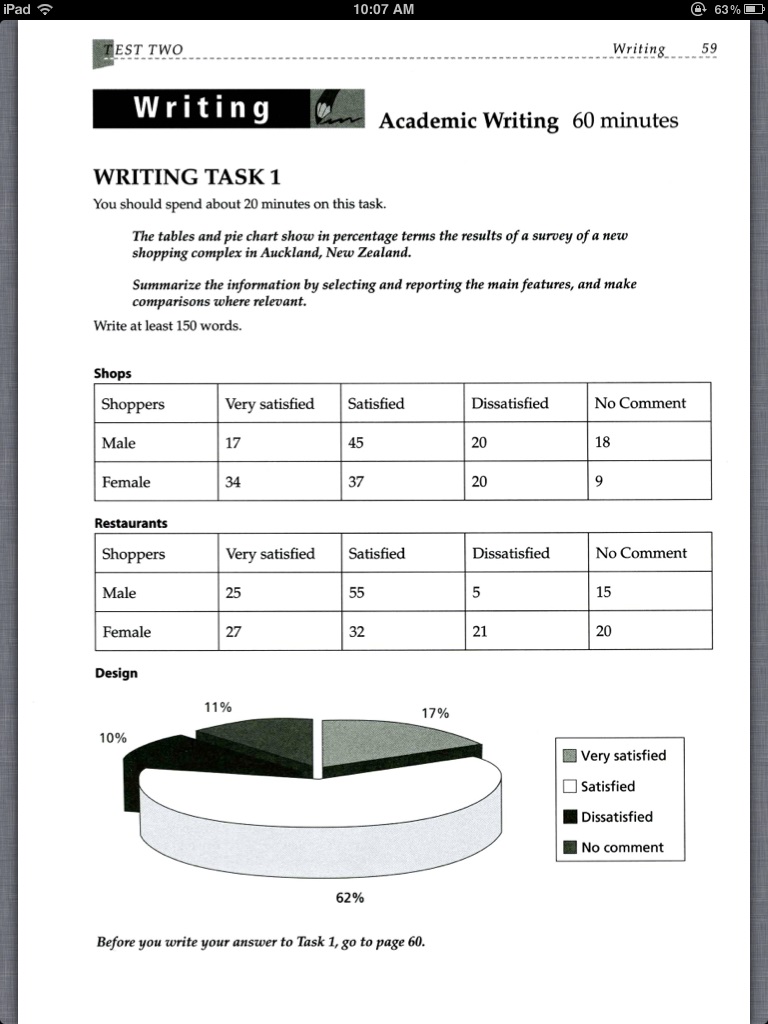
Ielts task1: The table and pie chart show in percentage terms the results of a survey of a new shopping complex in Auckland, New Zealand
Summarize the information by selecting and reporting the main features, and make comparisons where relevant.
The tables combining with pie chart illustrate information about how customers satisfy with Shops, Restaurants and Design of a shopping centre in Auckland, New Zealand.
As can bee seen from the tables, it is clear that Satisfied rates are much higher than Dissatisfied rates for both genders in all three aspects of the centre. For Shops, 62 per cent of Male (including 45 percent satisfied and 17 percent very satisfied) gave the commentS that they felt satisfied with this aspect and the number for Female is 71 percent (34 percent Very satisfied and 37 per cent Satisfied), while the number of customers did not satisfy is 20 per cent for both sexes. Males gave no comment are more than females, 18 percent and 9 percent, respectively. For Restaurants, there is a overwhelming majority of Male satisfying with this aspect ( 25% very satisfied and 55% satisfied) compared to only 5% customers dissatisfied. Number of female felt satisfied get 59% while 21% is number of female dissatisfied. 15% and 20% are numbers of male and female gave no comment, respectively.
For Design, we can see the same trend from the pie chart for both sexes with Satisfied rate accounting for a overwhelming majority proportion of 79% (62% satisfied and 17% very satisfied) in comparison with only 10% dissatisfied. Customers gave no comment get 17%.
To conclude, almost customers felt happy with the shopping centre when they were asked.

Photo_Jun_23_10_07_.jpg
