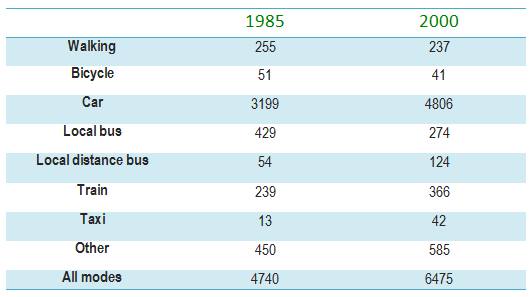
The table below gives information about changes in modes of travel in England between 1985 and 2000.
A breakdown of the information about the annual distance pace per person (measured in miles) in some modes of transport in England from 1985 to 2000 is presented by the table. Overall, all transport passed the longest distance in 2000 except local bus, in which car took the first position during the period.
Firstly, car was recorded the most transport to be used by people. It was proved by the distance passed between 1985 and 2000 at 3199 and 4806 respectively. However, there was a slight increase in cycling and walking by 10 and 20 miles respectively in which walking's distance five times in size of cycling during the period.
Meanwhile, public transportation had the long gap each other. Other modes were the highest achievement of driving, which showed a slight incline from 450 to 585. Local bus was the mode that experienced a declining from 429 to 274. It doubled of train's distance in 1985. However, train increased around 100 miles of distance. Taxi and local bus distance inclined three times and two times respectively from 1985 to 2000, which in the end, taxi was two times lower than local bus, at 42. All modes were recorded higher in 2000 by 1335 of gap.

ataask_15327590_1020.png
