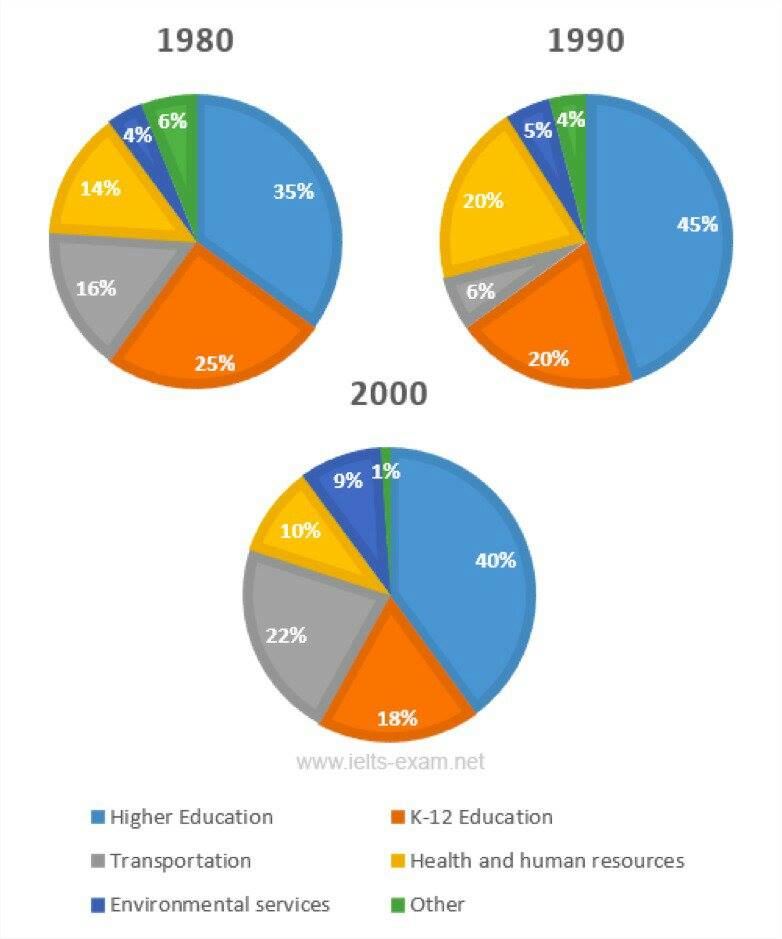
The three pie charts show the change in annual spending by local authorities in Someland in 1980, 1990 and 2000.
The pie charts compare about the percentage of annual expenditure which Someland's local government spend in six aspects in three decades (1980, 1990 and 2000). Overall, it is interesting to notice that the local government spent most budget for higher education, while they allocated least for other aspect.
At the beginning of period, education and transportation got bigger fund then others. The local government expended almost a half of their budget for higher education during the period. In contrast, although lower education stood at a quarter in the first decade, it decreased gradually to 18% in the end of the period. About 16% of annual outgoings was spent on transportation in 1990, and it rose to 22 percent in the end of period thought the middle decade showed a 16% less than the end of period.
On the other hand, the rest aspects such as environmental services, health and human resources, and other gained only under a fifth of expenditure. Other fell slightly during the period, while environment services faced a slowly grow over three decades. Health and human resource aspect went down to 10% in 2000 although it raised 20% in the1990.
government spendings on six aspects in three decades
The pie charts compare about the percentage of annual expenditure which Someland's local government spend in six aspects in three decades (1980, 1990 and 2000). Overall, it is interesting to notice that the local government spent most budget for higher education, while they allocated least for other aspect.
At the beginning of period, education and transportation got bigger fund then others. The local government expended almost a half of their budget for higher education during the period. In contrast, although lower education stood at a quarter in the first decade, it decreased gradually to 18% in the end of the period. About 16% of annual outgoings was spent on transportation in 1990, and it rose to 22 percent in the end of period thought the middle decade showed a 16% less than the end of period.
On the other hand, the rest aspects such as environmental services, health and human resources, and other gained only under a fifth of expenditure. Other fell slightly during the period, while environment services faced a slowly grow over three decades. Health and human resource aspect went down to 10% in 2000 although it raised 20% in the1990.

pie_chart.jpg
