The annual rice production of 4 countries
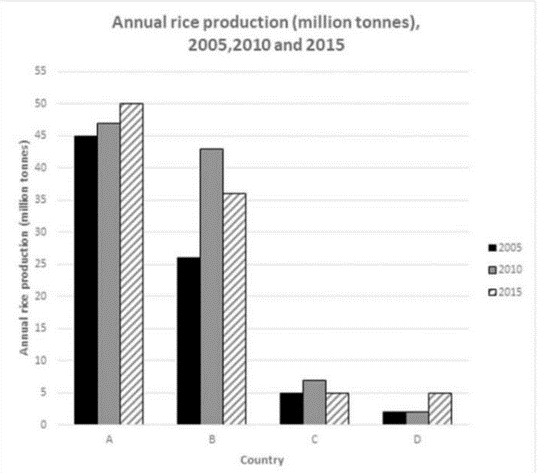
The bar chart compares four different countries in terms of the amount of rice produced annually in 2005, 2010 and 2015. It is noticeable that the rice production of country A and B overtook that of country C and D by a wide margin. In general, while there was an increase trend in the output of rice in three out of four countries between 2005 and 2015, the figure for country C remained gradually the same.
In 2005, the productivity of rice of the country A was 45 million tonnes, compared to nearly 26 million tonnes of the country B. However, the total outputs of rice in B rose significantly to 43 million tonnes and closely caught up the productivity of A, at 47 million tonnes. The amount of rice per year produced by A kept the same trend and went up to 50 million tonnes in 2015. The figure for the country B bucked the trend with seven million tonnes decrease.
By contrast, the rice industry of the country C and D were considerably lower than other countries, with 5 million tonnes and 2 million tonnes respectively in 2005. By 2015, the amount of rice production of the country C and D shared comparable figures, with 5 million tonnes each.

Picture1.png
