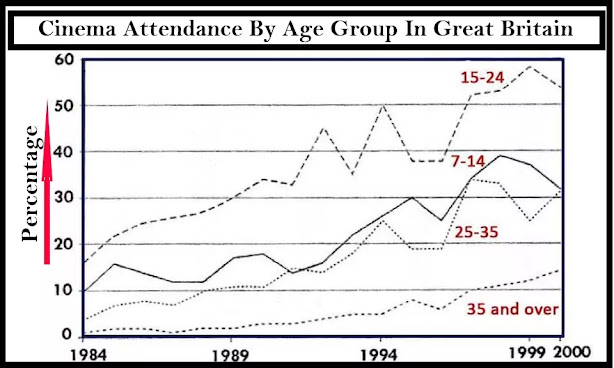
The line chart shows average attendance at the cinema among various age groups in the US from 2000 to 2011.
The line chart represents the proportion of attendance at the cinema among various age demographics between 2000 and 2011 in the US. It is clear that the percentage of people going to cinema in the US witnessed an upward trend. In addition, people who are 15 to 24 years old went to cinema more frequently than other groups.
In 2000, the 15-24-year-old group began with 15% going to the cinema, and then increased steadily to over 30% by 2004, fluctuating between 30% and 50% for the next three years. However, the figure decreased rapidly by 35% in 2008 and finishing at 52%. Meanwhile, the figure for the age of 35 and up rose consistently, beginning at 1% and ending at a high point of 13% in 2011.
Looking at the other groups, both had fluctuation roughly similar. From 2000 to 2005, cinema-goers who were 7-14 and 25-35-year-old go up slightly and reached 10% in 2005. After that, those aged 6-14 go up stably between 2006 and 2010 but suddenly declined to under 30% in 2011.
Summarise the information by selecting and reporting the main features, and make comparisons where relevant.
The line chart represents the proportion of attendance at the cinema among various age demographics between 2000 and 2011 in the US. It is clear that the percentage of people going to cinema in the US witnessed an upward trend. In addition, people who are 15 to 24 years old went to cinema more frequently than other groups.
In 2000, the 15-24-year-old group began with 15% going to the cinema, and then increased steadily to over 30% by 2004, fluctuating between 30% and 50% for the next three years. However, the figure decreased rapidly by 35% in 2008 and finishing at 52%. Meanwhile, the figure for the age of 35 and up rose consistently, beginning at 1% and ending at a high point of 13% in 2011.
Looking at the other groups, both had fluctuation roughly similar. From 2000 to 2005, cinema-goers who were 7-14 and 25-35-year-old go up slightly and reached 10% in 2005. After that, those aged 6-14 go up stably between 2006 and 2010 but suddenly declined to under 30% in 2011.

14876438_54700346882.jpeg
