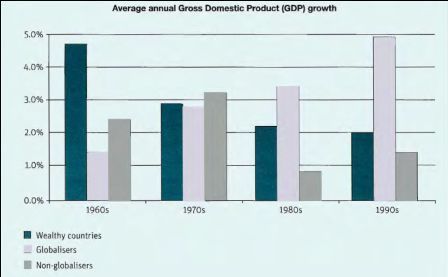
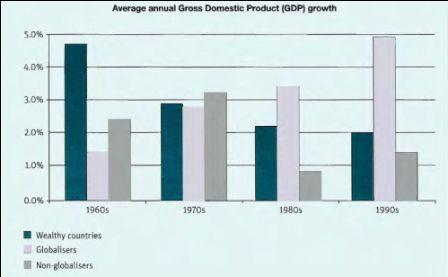
The graph below shows the average growth in domestic products in wealthy countries, countries that have adopted a global approach to business and countries that have not.
Write a report for a university lecturer describing the information below
The bar chart belows show about average annual Gross Domestic Products (GDP) growth in a four edge between 1960s-1990s. There are three kind of countries whom take part in this report; Wealthy countries, Globalisers, and non-Globalisers.
In the beginning, let us see the chart movements of wealthy countries. In 1960s, the number of GDP growth about 4,8 percent, and it is become the highest portion in over a 4 years edge. The number was gradually falling in the twenty years forward. Started around 1 percent decreasing, the number of GDP become 3,8 percent in 1970s and falling again to 2,2 % in 1980s period. Then, this condition sharply falling about 2 percent in 1990.
Let us turn into Globalisers GDP growth whom condition contrary different. The GDP number awake about 1,2 percent in 1960s and rising to 2,9 in 1970s period. To look forward, the percentage was increasingly arise year by year. In 1980s the number of GDP is about 3,2 percent then the highest percentage nearest to 5 percent happening in 1990s.
The last group of countries which called Non-globalisers become the last discussion. Start with 2,2 percent in 1960s, the bar chart rolling fluctiative. In the 1970s the number rising become 3,3 percent before decline into 1,8 percent in 1980s. This condition changes in the 1990s, number of Non-globalisers increase again about 1,2 percent.
This is important to view that those of groups have different pattern in each. The Wealthy's countries GDP start with high percentage and then gradually falling in last year reporting. In contrast, Globalisers countries take position from below and rising as highest GDP point of whole groups after 40 years period. The last group have roller coaster pattern, whereas falling and rise in a-4 year period.
To conclude, Globalisers countries has the best GDP movement than others. Nevertheless, both of others groups should be evaluate to improve their GDP in the forward.
P.S Please give me advice for my grammar

annual_GDP_compress..jpg

