Annual expenditures on cell phones
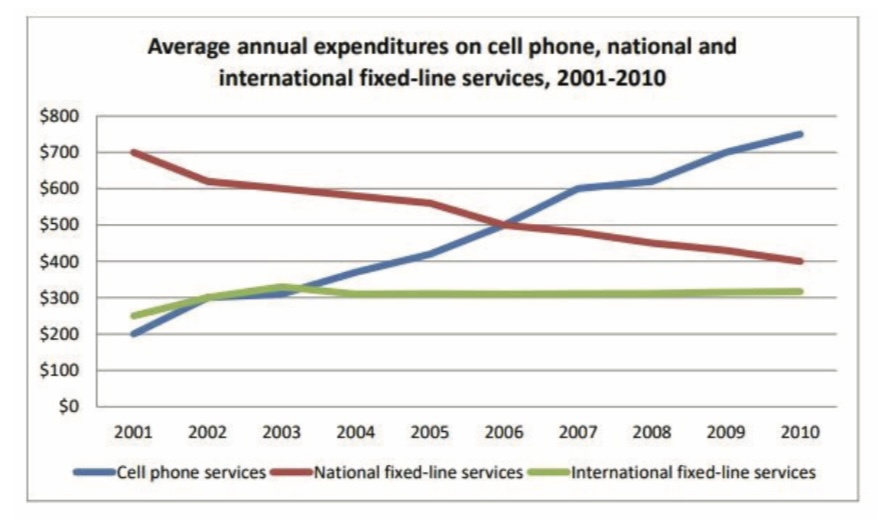
The line graphs illustrates the average amount yearly on cell phone, international fixed line service in the US over a period of 9 years from 2001 to 2010
It is clear that the figure for cell phone services incresed significantly, the opposite was true for international fixed line,whereas interntional fixed line still keep their stand over the period shown
In 2001, the averge of US residents spent on national fixed line was nearly 700$ comparison with mobile phones and international fixed line only around 200$. Over the next five years, the consumption amount of national fixed line fell by approximately 200$. In contrast, the figure for cell phone incresed roughly 300$. At the same time, yearly spending on international fixed line fluctating around 300$
In 2006, the amount consumers spent on cell phone and national fixed line was the same about 500$. From 2006 onwards, the figure for cell phone services was skyrocket nearly to 750$,while the average of national fixed line fell to 400$. During the period, international fixed line remained the same steady consumption.

07E80A5615DD4892A.jpeg
