Unanswered [1] | Urgent [0]
  

Home / Writing Feedback   % width   Posts: 3


The bar chart demonstrates a brief view of the percentage of Australians who exercised regularly


ngocmaing 3 / 6  
Oct 24, 2020   #1

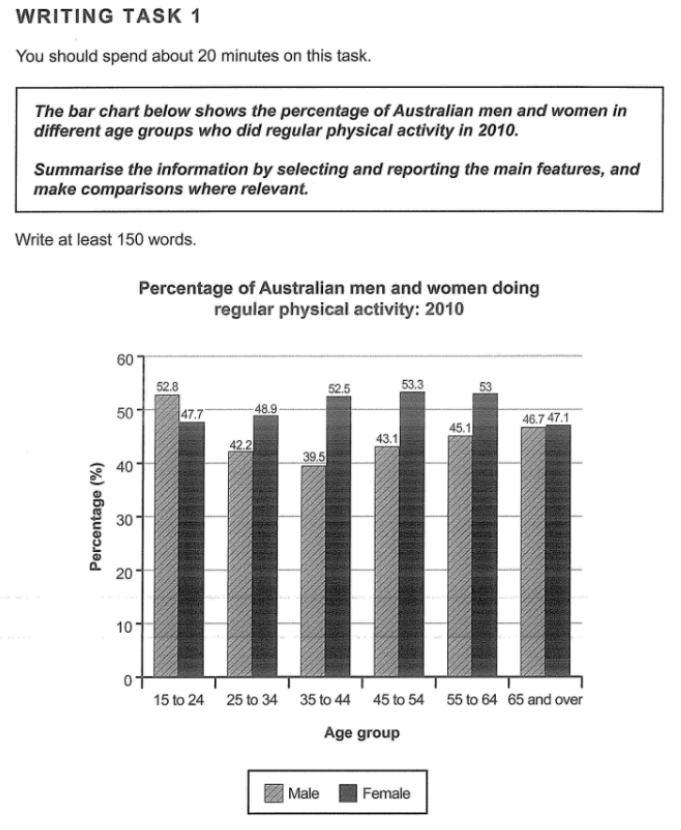
Percentage of Australian men and women doing regular physical activity


The given bar chart demonstrates a brief view of the percentage of Australian men and women in various age groups who did regular physical activity in 2010. It is obvious to see that the ratio between these two genders is consistent and does not have dramatic gap.

Overall, the percentage of Australian females is higher than the males in most age groups, except for the group of 15 to 24 years old in which the ratio of females to males is 47.7 : 52.8. We can assume that after the age of 25, women in Australian are reported to do more regular physical activity than men.

To be detailed, the most noticeable gap between the percentages of females and males in doing physical work regularly happens to be in the age group of 35 to 44 years old which is about 13%, making it the biggest gap. The smallest gap would be in the age group of over 65 years old, which is just 1%.

To conclude, it can be said from the bar chart that the percentage of Australian men and women doing physical work regularly in 2010 is fairly even.

P/S: Thank you for spending time checking my essay as I really appreciate! I haven't write any Ielts essay for quite a long time so the quality is not very good. But if you are an Ielts examiner or were an Ielts examiner, may I ask if you can give me score to reflect on this essay so I can improve myself more? Thank you very much!

  • 1241020.PNG


Holt  Educational Consultant - / 15344  
Oct 24, 2020   #2
Hi, we used to offer scoring as a part of our free services. As of now, the scoring service is already part of our premium services. You may request for scoring when you avail of our private essay review service or when you make your thread URGENT. Any student who scores an essay for another student will find his account suspended. As of now, I can provide you with a complete free review service. Here we go:

Your summary overview is too similar to the original prompt presentation. This will be deemed closer to a cut and paste or memorized representation of the prompt, which will result in score deductions for you. The information provided in the summary is incomplete as you did not include the age range as referred to in the chart. You could have indicated that the age range was from 15 to over 65 to help complete the summarized information.

Do not make assumptions in the task 1 essay. You must only provide the actual information from the bar chart. Do not make assumptions in the presentation when these are presented as facts in the image. So the fact is, the percentage of women exercising increases after the age of 25. You will not score extra points for making assumptions where none is presented in the original image.

This essay does not require a conclusion as it is a summarized report. Rather, you should be presenting your conclusion as the actual trending statement in your summary overview. Do not separate your presentation so much to meet a 4 paragraph requirement when the original prompt allows for only 3 paragraphs. Trying to lengthen the presentation for no reason isn't going to increase your scoring ability.
OP ngocmaing 3 / 6  
Oct 25, 2020   #3
@Holt Thank you for your review! I will rewrite and learn from this.


Home / Writing Feedback / The bar chart demonstrates a brief view of the percentage of Australians who exercised regularly
Do You Need
Academic Writing
or Editing Help?
Need professional help with your assignments? Fill out one of these forms:

Graduate Writing / Editing:
GraduateWriter form ◳

Best Essay Service:
CustomPapers form ◳

Excellence in Editing:
Rose Editing ◳

AI-Paper Rewriting:
Robot Rewrite ◳