please help to know my mistake and mark in 4 criterion in writing task 2: task achievement, coherence and cohesion, lexical resource, grammatical range and accuracy. If i want get 7 plus band ...what to do in this writing.
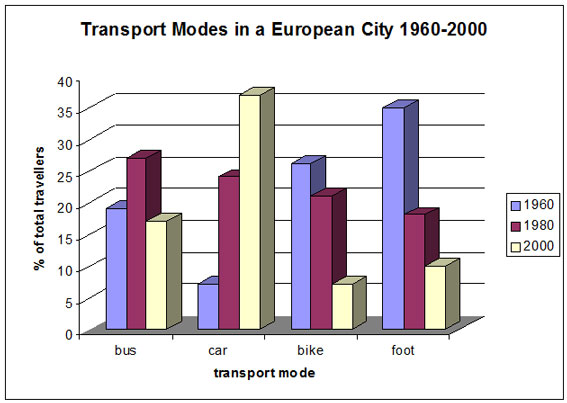
Bar chart shows the different modes of transport used to travel to and from work in one European city in 1960, 1980 and 2000.
A breakdown of information about the changing patterns of transport use in a European city in forty years from 1960 to 2000 is presented in bar chart. Overall, it is important to note that a significant increase was in the use of the car as a means of transport, while the popularity of bike use and walking habit decreased, and the use of bus experienced a fluctuation during the period.
In 1960, the proportion of use of motor car was least with only about 7% , but this use rocketed to 23 percent in 1980. It then continued to finally reach about 37% 2000, a massive 5-fold increase in use in forty years.
In contrast, as transport mode, Bicycle and foot had been experienced a downward trend. Foot was the trendiest means of transport with 35% in 1960, but this plummeted to a low of 9% during the period. Likewise,bicycle use fell from a high of about 27% in 1960 to just 7% in 2000. However, the figure for bus use went up, by 8% from the 1960 figure of 19% before falling back to about 18% in 2000.
thanks in advance.. :)

xieltsgraphtranspo.jpg
