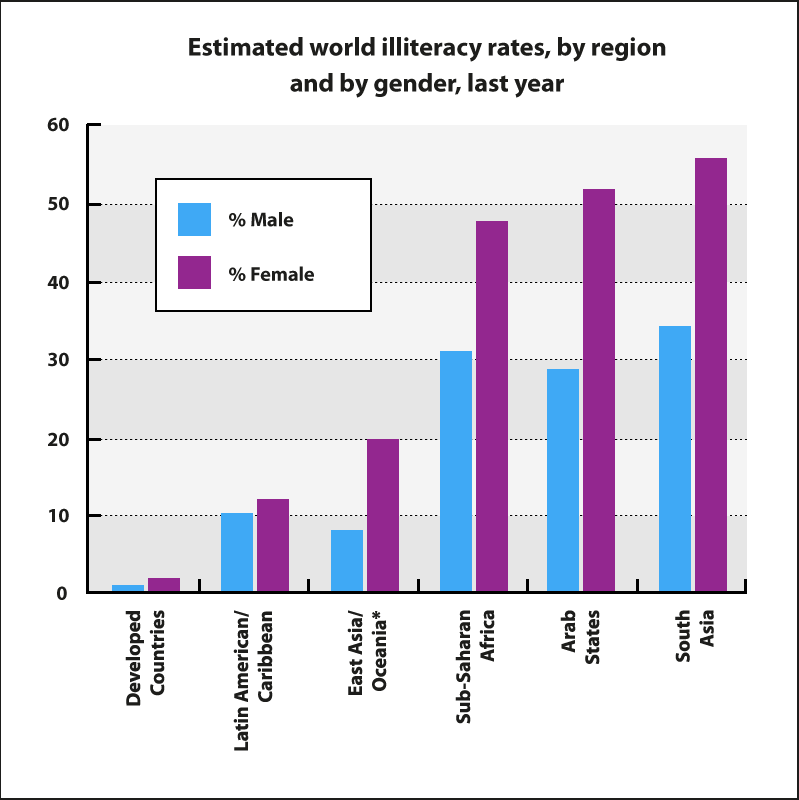
The chart shows the estimated level of illiteracy for regions in the world and by gender in the past year.
Overall, the developed countries had the lowest level of illiteracy compared to South Asia and Arab states. It is estimated that females in all the regions of the world are less literate compared to men.
The number of uneducated females in East Asia/Oceania is more than half of Sub-Saharan Africa while over 30 percent of men in these regions have lower education.
South Asia has a total of over 97 percent of both genders topping the chart with the highest illiteracy rate while the developed countries have less than 5 percent. Sub-Saharan Africa and the Arab States have more females than males with less education at 48 per cent and about 52 percent respectively.
The region with the lowest literacy rates aside from developed countries is Latin America/Caribbean. This region has about 10 percent and 12 percent rate in males and females respectively which does not make up to 50% of the highest illiteracy rate in the world.

estimatedworldilli.png
