The bar chart analysis
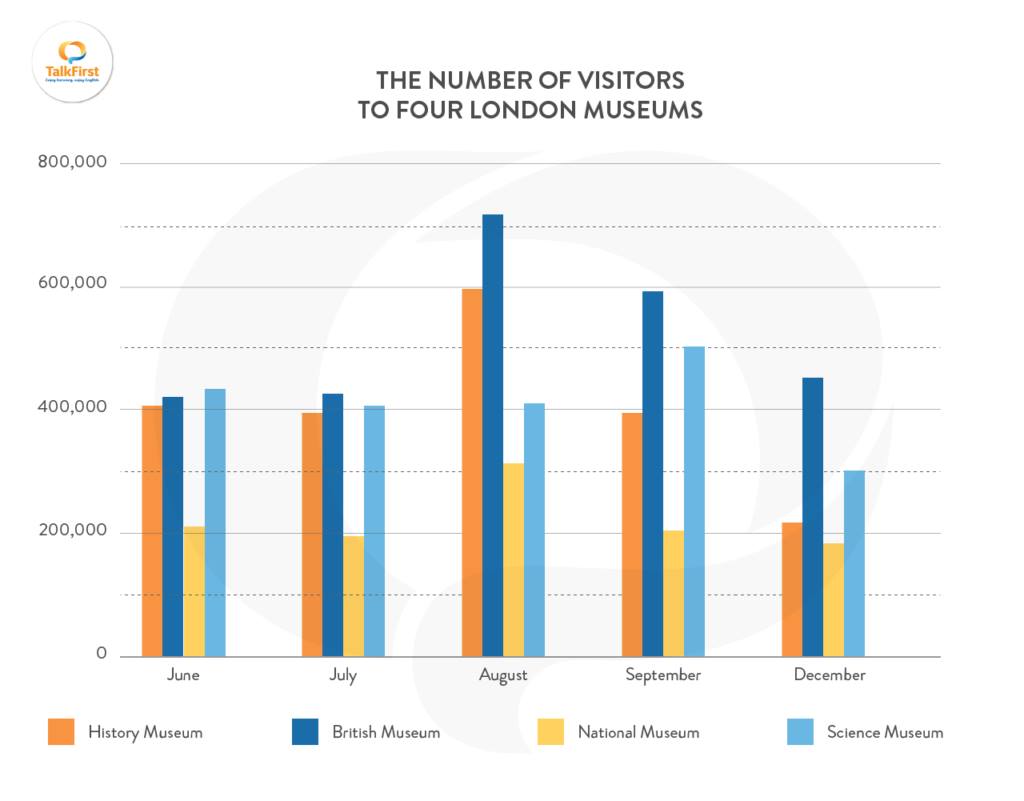
The bar chart shows the illustration of the number of people visiting four different museums located in London.
Overall, it could be observed that the British Museum was the most popular while the National one was the least common. Additionally, most visitors had the tendency to visit museums in August; in contrast, December witnessed the lowest number of visitors.
At the beginning of summer, there was no change in the number of tourists in the History Museum, British Museum and National Museum, except for the Science one. It was obvious that the Museum of Science experienced a slight increase, from more than 400,000 to exactly 400,000 people.
In August, the British Museum, History Museum, and National museum soared dramatically, with approximately 700,000; 600,000, and 300,000 people respectively. However, in the last two months of the period, the figures for these 3 museums dropped significantly. In terms of the Science museum, the number of tourists fluctuated from 400,000 to 300,00 people and reached a point of 600,000 visitors at the end of fall.

250416760_4018922183.jpg
