Unanswered [1] | Urgent [0]
  

Home / Writing Feedback   % width   Posts: 2


IELTS WRITING TASK 1: BAR CHART ABOUT WEEKLY EXPENDITURE.


Gabriell 4 / 5  
Sep 26, 2022   #1

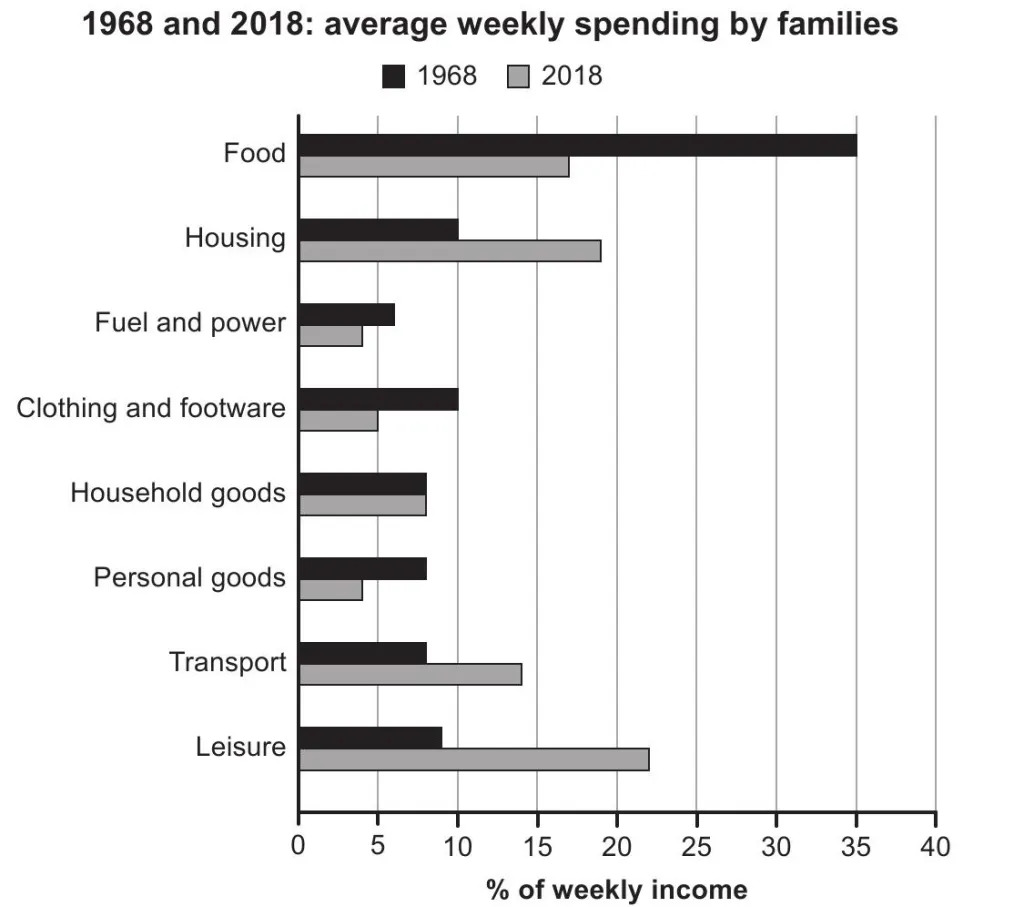
The chart below gives information about how families in one country spent their weekly income in 1968 and in 2018.


MY ESSAY:
The bar chart given presents data on how households in one particular nation spent their weekly income in the years 1968 and 2018.

Overall, the way families in this country spent their weekly income changed significantly over the period shown. Most notably, although in 1968 most families' weekly income went into food, households spent most on housing and leisure in 2018.

In 1968 weekly income of each family to buy food was at 35%, around three times higher than that on housing, clothing and footware. During this year, the proportion of weekly income spent on household goods, personal goods, transport, leisure and fuel never exceed 10%.

In the next 50 years, the percentage of weekly income spent on food halved to around 17%, lower than housing and leisure which were about 18% and 22% respectively. The expenditure on personal goods, clothing and footware also fell heavily in 2018. Meanwhile, each household's weekly income proportion on fuel and power decreased slightly by 2% and this percentage for household goods did not vary during this period.

(173 words)

  • cam17t13.jpg


Holt  Educational Consultant - / 15385  
Sep 27, 2022   #2
There are a few things that the exam taker can do to improve the scores for his summary overview paragraph. Firstly, he can stop using the memorized sentence format for the presentation to show that he has more advanced writing abilities. Rather than simply saying that there is "given data", he can instead format the sentence to indicate "comparisons of given information regarding both years". That sounds more original and complex in writing presentation than simply "presents data". He can also add the measurement instrument (percentage) to the summary to indicate that the comparative data was collated and analyzed using a specific method / formula.

Since this is a single image, there is no need to spread out the information over 4 paragraphs. The student is consistently using placeholders as taught in books and schools to show how the thoughts should be separated. However, these formats do not follow the basic 3-5 sentence format of acceptable (academic) paragraphs. The summary and the overview should always be connected as connected information in a single paragraph, regardless of paragraph position. These 2 sections will be scored collectively based on its C+C and use of transition phrases / connecting words.


Home / Writing Feedback / IELTS WRITING TASK 1: BAR CHART ABOUT WEEKLY EXPENDITURE.
Need Writing or Editing Help?
Fill out one of these forms:

Graduate Writing / Editing:
GraduateWriter form ◳

Best Essay Service:
CustomPapers form ◳

Excellence in Editing:
Rose Editing ◳

AI-Paper Rewriting:
Robot Rewrite ◳

Academic AI Writer:
Custom AI Writer ◳