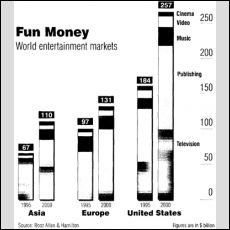
The graph below shows how money was spent on different forms of entertainment over a five-year period. Write a report for a university lecturer describing the information shown below.
The bar graph illustrates us the expenditure of money on various kinds of amusing facilities from 1995 to 2000.
We can see that the highest amount of money was related to the United States, because it was over $250 billion in 2000 in comparison with the spending sum in the same country in 1995.
The situation in Europe and Asia looked approximately similar. In both regions was expended over $100 billion in 2000 and slightly less money in 1995.
The graph indicates that Publishing was the most popular sort of amusement in all regions. Television had been necessary as well. On the third place was Music. Video and Cinema did not differ to each other roughly.
Overall, from the given bar chart it is obviously that in certain regions people spent on several recreational activities more money than the others. But in all of them the most significant level of financial quantity belonged to such forms as Publishing and Television.
It is my first chart describing. I suggest there are a lot of unlinked thoughts. maybe I could not group them in correct way, but I spent on it 25 min (It is long I know:() and there are ~ 168 words
Would you telling me whether I might be successful in writing test in IELTS. It is very important for me. Could you assess y essay and tell me how much score I might got from it?
Thank you in advance!

121528_1.jpg
