Hi, everyone
I'm new in this forum and I have some problems when i try to write essay. Please fix it for me. Thanks a lot !!
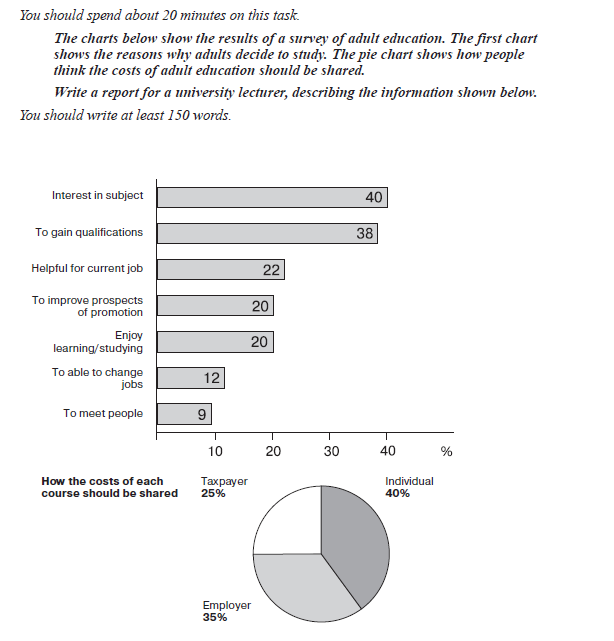
The bar chart illustrates main seven reasons that people make decisions for their studying and pie graph demonstrates the percentages of adult groups think who should pay the education cost for them.
According to first chart, having interest in subject and wanting to raise knowledge on their field are the two most popular reasons for people making their decisions with 40% and 38%. There are 3 reasons in middle group including helping for their jobs, getting promotion and enjoying on learning stay around 20%. The last reason group has the lowest rate that people in it just want to have new jobs and go studying to meet the others stay at 12% and 9%.
In the latter chart, the survey gives out three targets which will pay the cost of education. 40% of people who are asked tick on the individual blank while others think that taxpayer and employer share in turn 25% and 35%

Untitled.png
