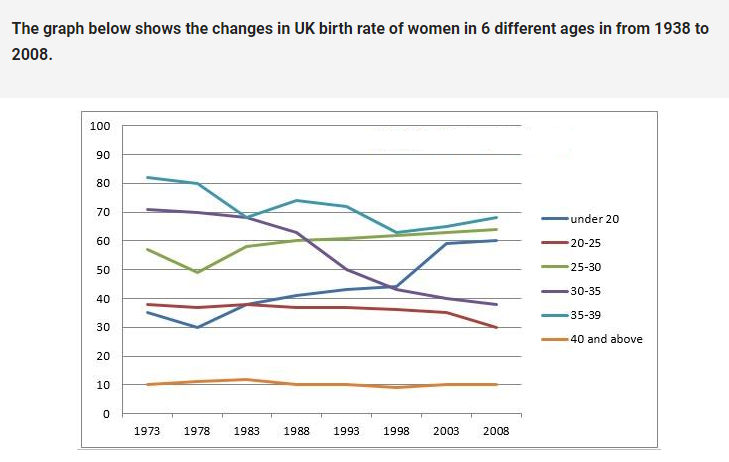
women's fertility rate in the uk
The line graph illustrates the fertility rate of females in 6 various age groups in the UK over a period of 15 years, starting from 1973.
Overall, while the birth rate of 35-to 39-year-olds recorded the highest figure, the opposite was true for people who aged 40 and above.
In 1973, over 80% of females between 35 and 39 years old gave childbirth, 10% higher than that of women in the first half of their thirties. This was followed by people who fell into the 25 to 30 age group with under 60%. The proportion of females giving birth under 20 and between 20 and 25 was relatively equal, around 35%, over threefold higher than the smallest figure for the 40-and-above age group.
From that time onwards, despite some declines to under 70%, the 39largest birth rate still belonged to 35-to 39-year-olds, compared to a significant decrease to just under 40% of women aged 30 to 35. In contrast, after a slight drop by approximately 5%, the percentage of 25-to 35-year-old and under 20 age groups increased to above 35% and precisely 30% respectively. In comparison, women aged 20 to 25 and 40 and above shared the same stability.

Capture.PNG
