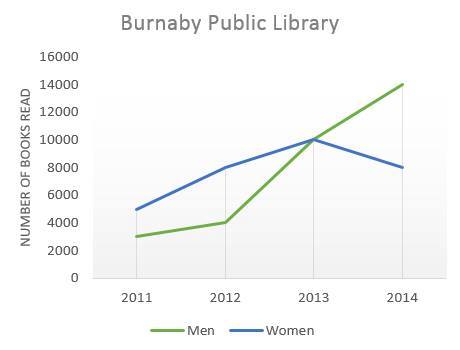
The graph below shows the number of books read by men and women at Burnaby Public Library from 2011 to 2014.
Summaries the information by selecting and reporting the main features, and make comparisons where relevant.
The presented line graph shows the total quantity of books being perused by women and men in Burnaby public library over four years. It is obviously seen that the men's reading desire for reading is higher than women despite both of them having an upward trend
In 2011, nearly 4500 books were read by women then the quantity was higher to 8000 in 2012. After that, the number of books that had been perused by women increased about 2000 in the next year. The last, by the end of 2014, the number of books that was read in Burnaby library by women had tremendously declined.to 7000 books.
3000 books enjoyed by the men reader in 2011. Then in 2012, it increased about 1000 books. By 2013, the total books that had been read by men had rose dramatically become 10000 books and it continuously soared until 2014 with 14000 books had been perused by men in Burnaby public library.

14717037_12963625570.jpg
