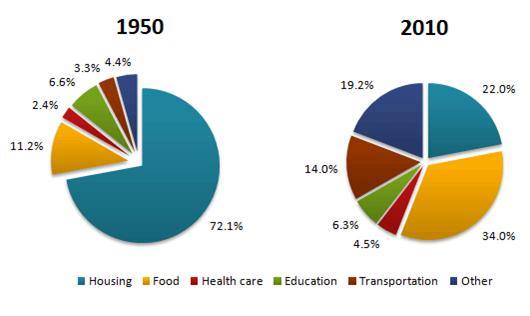
The pie charts below show the average household expenditures in a country in 1950 and 2010
A breakdown of the average expenditures for household in six decades (from 195- to 2010) is illustrated in pie chars. At first glance, it was immediately apparent that an extremely change of the average expenditures expended in household. While two kinds of expenditures became increased sharply, the others experienced a reverse.
First decade portrayed that expense for housing spent in household at more than seven in ten. However, in 2010 this realm changed profoundly and the biggest expense was used for food expenditure at 34.0%, increase by approximately 33%, while the expense to buy housing need witnessed a sharp decrease, at 22.0%. A remarkable increase also witnessed in paying transportation, it rose by almost 11%, from 3.3% to 14.0%.
Move to more detailed analysis. Expending for another demand was conducted in paying health care, education. However, 2010 depicted there was no a significant change both in paying health care and education, at 4.5% and 6.3%, just changed by 0.3% and 2.1% respectively.

piechart_houshold.jp.jpg
