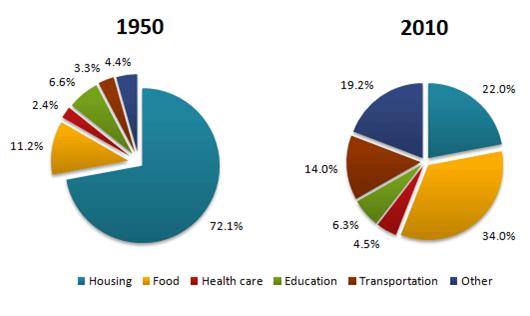
The pie charts below show the average household expenditures in a country in 1950 and 2010.
A breakdown of the proportion of the average of household consumption in 1950 and 2010 is presented in pie charts. At first glance, the highest number of homely activity were housing and food on the different year. While, there were housing, food, health care, education and transportation as the subject of household activity.
Moving to a more detailed analysis, housing in 1950 was the biggest number of household consumption. That was different with the number of housing in 2010. However, 1950 was larger than 2010 between 72.1% and 22.0%. However, 1950 consumed three times more housing than 2010. In contrast, 2010 showed that food was the majority number just less than a third of the percentage. Then, 2010 showed the number of food larger than 1950. Followed by, housing increased dramatically as the second biggest group during six decades.
Subsequently, there were many steady rise from 1950 to 2010 such as transportation, health care and others subject. Transportation rose steadily from 3.3% to 14.0% over six decades. Transportation was larger than education in 2010. However, education was consumed in 2010 smaller than in 1950, the range around less than one in twenty.

the_pie_charts.jpg
