Writing task 1 - bar chart report
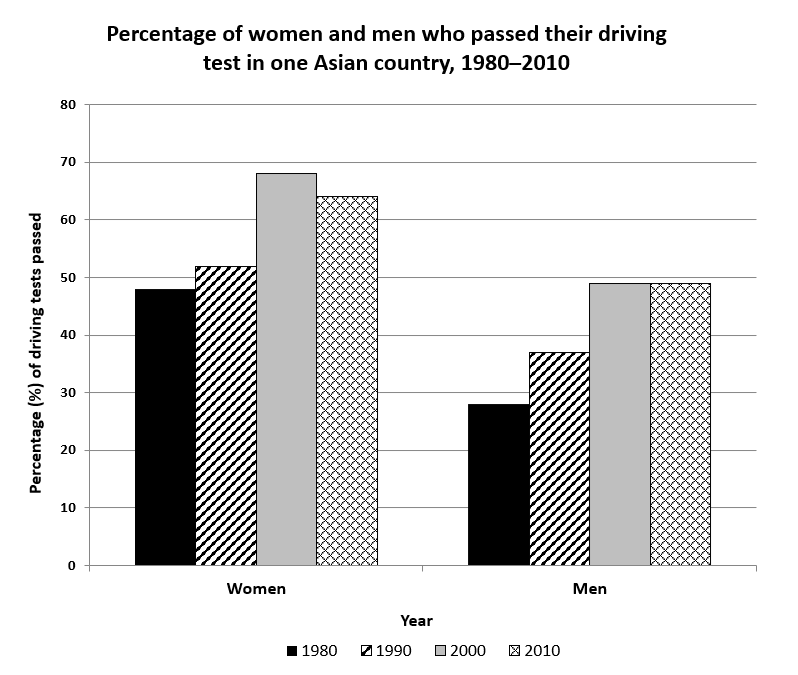
The chart shows the percentage of women and men in one Asian country who passed when they took their driving test between 1980 and 2010.
Summarise the information by selecting and reporting the main features, and make comparisons where relevant.
You should spend about 20 minutes on this task.
Given is the bar chart depicting a breakdown of male and female inhabitants passing the driving test in a particular Asian nation during a forty-year period.
A brief assessment of the graph reveals that there was an upward trajectory in the proportions of both genders during the first three decades. Interestingly, the figures of females invariably outnumbered their male counterparts throughout the surveyed period.
It is patently obvious that the period during 1980 and 2000 saw a gradual climb in the proportions of female test-takers. To exemplify, the year 1980 occupied roughly 48%, after which the figure increased a shade to 51% in the next one year before reaching a record high of approximately 70% in 2000. A moderate swell of 3% was observed in the researched data of females in 2010.
Apparently, men experienced similar patterns as women in the equivalent timespan (1980 to 2000) with notably lower figures, occupying 28%, 37%, and 49.5% respectively. It is striking that the percentage of males who passed the test remained unaltered in 2010, at 49.5 %, which was 13.5% low compared to 63% of females.
Can you give me a band score for this task, please?

3a99ec43c6524c638.png
