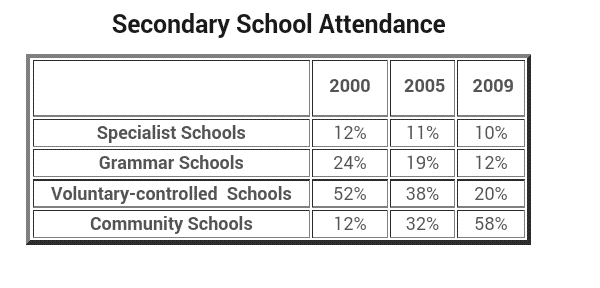
A breakdown of the proportion of student attendance in four different types of secondary schools from 2000 to 2009, a nine-year period is presented in the table. Overall, it can be seen that attendance of students in all of school types had changed each year. In any case, by far the most significant growth in the number of attendance in community's student, whereas the figure for remaining three school types displayed a progressive decrease in pupil attendance over the period.
According to the data, the most popular schools to be attended by student was voluntary-controlled schools, at 52% in the beginning period, it rocketed down by 32% over the next nine years. Compared with specialist and grammar schools represented at under 25% in 2000, so the gap number between these schools had really widened. Then, both schools fell considerably in almost the same number of student in the end of period.
A more detail look at the table reveals that the opposite was true in the case of community schools. Differently, although starting the time with only a small minority of students was at 12%, there was rose dramatically over half of pupils during the following nine years, which was the highest number over the time.

Screenshot_2015111.png
