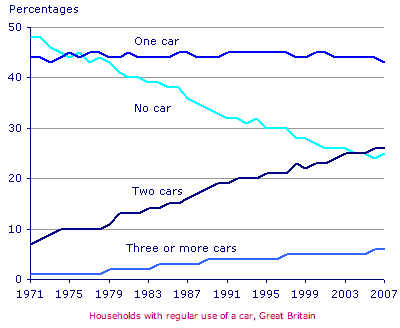
A comparison of alteration in the number of cars per household in Great Britain between 1971 and 2007, a 36-year period is illustrated in the line chart. Overall, car ownership in Britain increased over the remainder period. In any case, the number of households with two cars rose, while the number of households without a car fell.
In 1971, British households were more likely to possess one car. Almost a half of proportion, at around 44% of households had one car. However, there was little change in the figures for this category at the end of the period. For families which own three or more cars witnessed very low, with around 2%, and the proportion of households with more than two cars rose by around 5%.
A more detailed look at the chart reveals that the biggest change was seen in the proportion of households without a car., which, fell steadily over the 36-year period to around 25% in 2007. In contrast, over the following 36 years, the proportion of two-car families grew steadily, reaching about 26%.

line_graph_exercise..png
