Unanswered [1] | Urgent [0]
  

Home / Writing Feedback   % width   Posts: 3


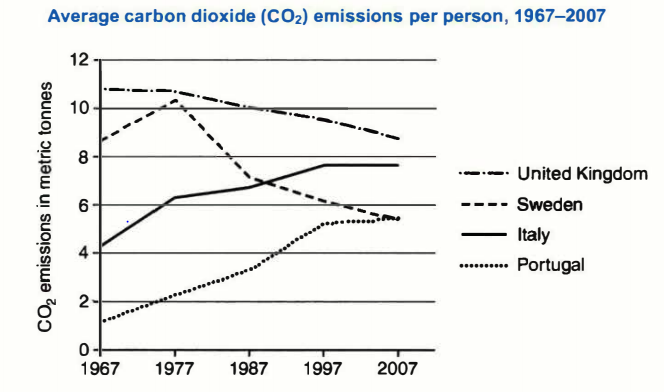
Task1: How much carbon dioxide an average person in four countries emitted into the environment


Tantan7012 1 / -  
Sep 19, 2020   #1

Average carbon dioxide emissions per person


The graph provides the information about how much carbon dioxide that an average person in four countries emitted into the environment between 1967 and 2007.

Overall, it is noticeable that the amount of carbon dioxide in Sweden decreased far faster than the other countries in the first decade.

There were two basic trends: downward and upward. As regard the first, the emission for Sweden reach a peak of about 10 over the first decade, followed by a sudden drop to under 6. During the same period, British reduced the amount of carbon dioxide gradually at approximate 9 in 2007 in comparison with 11 in 1967.

By contract, the figure for both Italy and Portugal went up by varying degrees. The former saw a significant rise in the first ten years and continue to increase slightly ending the year 2007 at about 8. Likewise, the trend for Portugal was upward. This country recorded a dramatical climb in emission from 1 to 5.5 per person after forty years.

  • Capture.PNG


LadyOfClockwork 30 / 100  
Sep 19, 2020   #2
Hi, I think you missed an improtant trend. That is: the United Kingdom was always the biggest emitter of carbon dioxide, though its emissions was in constant decline. You illustrated the change in emissions in each single country during the period. That's great. But I think that you may also want to make comparisons between the countries listed.
Holt  Educational Consultant - / 15384  
Sep 20, 2020   #3
Your summary overview is a run on and neglects to indicate important summary information such as:
- What the 4 countries listed are
- What measurement type is used (metric tonne)
- Type of image (line graph)

The "overall" statement is a trending statement. Therefore, you cannot say that there are 2 basic trends in the presentation. There are only upward and downward measurements. The overall trend, as it is properly phrased, is what you stated as a stand alone sentence, that the measurement in Sweden decreased faster than the other countries. It should have been part of the summary overview as that is the conclusion of your observation of the information from the line graph.


Home / Writing Feedback / Task1: How much carbon dioxide an average person in four countries emitted into the environment
Do You Need
Academic Writing
or Editing Help?
Fill out one of these forms:

Graduate Writing / Editing:
GraduateWriter form ◳

Best Essay Service:
CustomPapers form ◳

Excellence in Editing:
Rose Editing ◳

AI-Paper Rewriting:
Robot Rewrite ◳

Academic AI Writer:
Custom AI Writer ◳