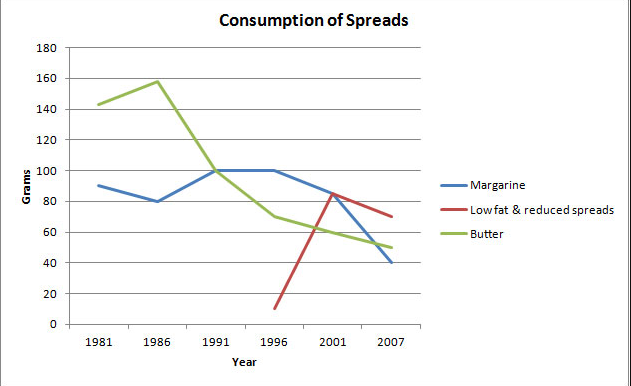
The graph shows the consumption of 3 spreads from 1981 to 2007
The line graph illustrates changes in the per capita consumption of margarine, low fat - reduced spreads, and butter between 1981 and 2007
Overall, it is noticeable that butter was by far the most popular of the three types of spreads for the majority of the 26 - year period. However, a considerable rise can be seen in the consumption of low fat-reduced spreads, with figures eventually surpassing those for consumption.
Between 1981 and 1986, butter consumption rose from around 140grams to a pick of 160 grams per year. During the same period, consumption of margarine stood at 85 grams and decreased significantly. Low fat-reduced spreads were by far the least most popular used.
By 2007, the amount of butter had plummeted to around 50grams, by the consumption of low fat-reduced spreads reached the highest point, at 89grams in 2001 and declined slightly. By contrast, there was a hit the lowest point of 40 grams in the number of margarine.
(171 words)

Screenshot7.png
