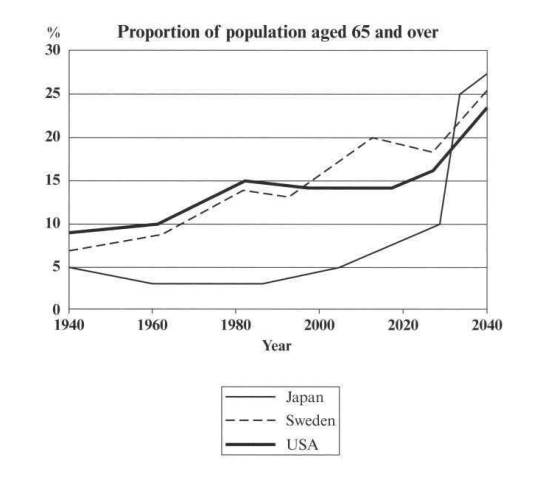
The graph below shows the proportion of the population aged 65 and over between 1940 and 2040 in three different countries.
The graph below shows the proportion of the population aged 65 and over between 1940 and 2040 in three different countries.
The given line graph illustrates the percentage of residents whose age are 65 and over in Japan, Sweden, and the USA from 1940 to 2040.
As can be seen from the graph, it is clearly evident that the aged population of three countries is expected to increase over the course of 100 years, starting from 1940.
In 1940, the rate of elderly American registered the highest among the three, standing at around 8%. This proportion continued to grow to 15% in 1980, before reaching its predicted peak at nearly 25% in 2040. Besides, Sweden also experienced the same trend between 1940 and 1980. However, the percentage of elderly Swedish is forecasted to some fluctuations over the next 60 years, before a soar to 25%. On the other hand, the ratio of 65-and-over citizens in Japan experienced a downward trend in the initial 20 years and then remained unchanged at approximately 4% in the following 30 years. After that, there will be a gradual growth to 10% in the next 4 decades, before soaring by more than 15% at the end of the time frame.
(184 words)
elderly residents in Japan, Sweden, and the USA
The graph below shows the proportion of the population aged 65 and over between 1940 and 2040 in three different countries.
The given line graph illustrates the percentage of residents whose age are 65 and over in Japan, Sweden, and the USA from 1940 to 2040.
As can be seen from the graph, it is clearly evident that the aged population of three countries is expected to increase over the course of 100 years, starting from 1940.
In 1940, the rate of elderly American registered the highest among the three, standing at around 8%. This proportion continued to grow to 15% in 1980, before reaching its predicted peak at nearly 25% in 2040. Besides, Sweden also experienced the same trend between 1940 and 1980. However, the percentage of elderly Swedish is forecasted to some fluctuations over the next 60 years, before a soar to 25%. On the other hand, the ratio of 65-and-over citizens in Japan experienced a downward trend in the initial 20 years and then remained unchanged at approximately 4% in the following 30 years. After that, there will be a gradual growth to 10% in the next 4 decades, before soaring by more than 15% at the end of the time frame.
(184 words)
The given line graph illustrates the percentage of residents whose age are 65 and over in Japan, Sweden, and the USA from 1940 to 2040.
As can be seen from the graph, it is clearly evident that the aged population of three countries is expected to increase over the course of 100 years, starting from 1940.
In 1940, the rate of elderly American registered the highest among the three, standing at around 8%. This proportion continued to grow to 15% in 1980, before reaching its predicted peak at nearly 25% in 2040. Besides, Sweden also experienced the same trend between 1940 and 1980. However, the percentage of elderly Swedish is forecasted to some fluctuations over the next 60 years, before a soar to 25%. On the other hand, the ratio of 65-and-over citizens in Japan experienced a downward trend in the initial 20 years and then remained unchanged at approximately 4% in the following 30 years. After that, there will be a gradual growth to 10% in the next 4 decades, before soaring by more than 15% at the end of the time frame.
(184 words)

370C9725F2934B618.jpeg
