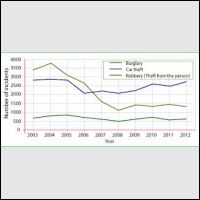
The chart shows the changes that took place in three different areas of crime in Newport city center from 2003-2012
Hi everyone, it's my IELTS writing task 1 practice. I hope I can know the mistakes and ways to fix them. Thank you.
"The line graph displays the alterations in level in three main areas of crime in the center of New Port city between 2003 and 2012.
In the general, the number of burglary incidents experienced the most noticeable change in the graph. Additionally, the figure for robbery was by far lowest during the research period.
In 2003, the quantity of housebreaking occurrences was highest, at nearly 3500, while the figure for car theft was slightly lower, at almost 3000 incidents. At the same time, the robbery cases stood at only around 600.
In 2008, after reaching its peak in 2004, at almost 3700, the number of burglary accidents declined dramatically and reached the lowest point of just over 1000. Similarly, there were slow falls for the figures of stolen cars and purse-snatching.
In 2012, the quantity of stolen car incidents rose sharply to around 3200 and became the highest figure in the chart. This year also witnessed gradual climbs to around 1400 and over 500 occurrences in the figures for breaking - entering and robbery respectively."
Hi everyone, it's my IELTS writing task 1 practice. I hope I can know the mistakes and ways to fix them. Thank you.
crime rate in New Port city
"The line graph displays the alterations in level in three main areas of crime in the center of New Port city between 2003 and 2012.
In the general, the number of burglary incidents experienced the most noticeable change in the graph. Additionally, the figure for robbery was by far lowest during the research period.
In 2003, the quantity of housebreaking occurrences was highest, at nearly 3500, while the figure for car theft was slightly lower, at almost 3000 incidents. At the same time, the robbery cases stood at only around 600.
In 2008, after reaching its peak in 2004, at almost 3700, the number of burglary accidents declined dramatically and reached the lowest point of just over 1000. Similarly, there were slow falls for the figures of stolen cars and purse-snatching.
In 2012, the quantity of stolen car incidents rose sharply to around 3200 and became the highest figure in the chart. This year also witnessed gradual climbs to around 1400 and over 500 occurrences in the figures for breaking - entering and robbery respectively."

274152_1.jpg
