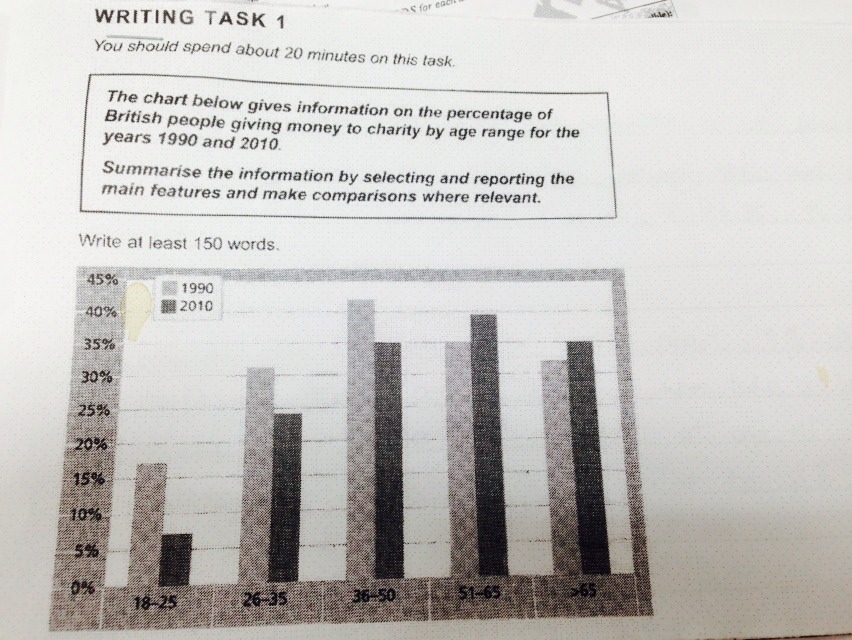
The bar chart show data about the proportion of UK people giving money to charity by age range between 1990 and 2010.
It made up of 5 age groups (18 to 25, 26 to 35, 36 to 50, 51 to 65 and 65 plus).
We can see from the year 1990.
Firstly, about 17% at the age of 18 to 25. Secondly, age of 26 to 35 were twice as high as age of 18 to 25.
After that it peak at age of 36 to 50, approximately 42%.
Finally, it decline to 35% and 32% at the age 51 to 65 and 65 plus, respectively.
Compare to the 1990. In 2010, It were slight about 7% at the age 18 to 25.
Following that jumped to 31% and 35% at the age 26 to 35 and 36 to 50, respectively.
It reach the highest level around 39% at age of 51 to 65.
In the end, it dropped to 35% at the age of 65 plus.
It is clear the most of proportion for UK people giving money to charity in 1990 were age of 36 to 50, and in 2010 were age of 51 to 65.
The lowest giving money to charity all at age of 18 to 25.

S__4980795.jpg
