Unanswered [1] | Urgent [0]
  

Home / Writing Feedback   % width   Posts: 2


The chart delineates how many boys and girls played six kinds of sports in an English town in 2012


tuahung248 1 / -  
Jul 3, 2023   #1

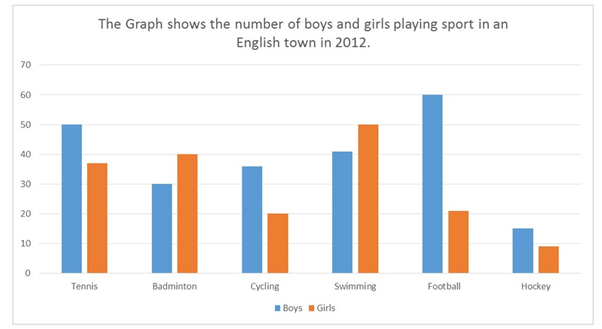
The graph shows the number of boys and girls playing sports in an English town in 2012


The chart delineates how many boys and girls played six kinds of sports in an English town in 2012.

Looking from an overall perspective, football and tennis were the most popular activities for the boys, while the girls were interested in badminton and swimming. In addition, hockey was the least popular in the town.

To begin with, there were four sports boys participated in more than girls. While 60 boys were interested in football, the number of girls who liked playing this sport was one-third of the boys at 20. Moreover, there were 50 boys who participated in tennis, while the girls were under 40. Moving on to cycling, more boys cycled than girls roughly 35 and 20 respectively.

Moving to the remaining sports, swimming witnessed 50 girls which was 10 higher than the boys. Similarly, there were 40 girls who participated in badminton while only 30 boys were interested in this sport.

  • Picture1.png


Holt  Educational Consultant - / 15385  
Jul 8, 2023   #2
There are several problems with the summary overview and trending statement. The summary overview does not give a precise acknowlegement of the type if image used. As there are several types of graphs used in this test, the exam taker is expected to precisely identify the type of graph use. Another problem, is that the enumerated listing is incomplete. It is always best to simply list the information for discussion rather than trying to create a trending statement using the references. Notice that you said there are 6 reference points, but you only enumerated 5. This will leave the reader confused and wondering why there are only 5 out of 6 references listed. The summary overview must always provide precise information since this is the part of the essay that gives the reader a mental picture of the upcoming report analysis.


Home / Writing Feedback / The chart delineates how many boys and girls played six kinds of sports in an English town in 2012
Do You Need
Academic Writing
or Editing Help?
Fill out one of these forms:

Graduate Writing / Editing:
GraduateWriter form ◳

Best Essay Service:
CustomPapers form ◳

Excellence in Editing:
Rose Editing ◳

AI-Paper Rewriting:
Robot Rewrite ◳

Academic AI Writer:
Custom AI Writer ◳