Unanswered [7] | Urgent [0]
  

Home / Writing Feedback   % width   Posts: 2


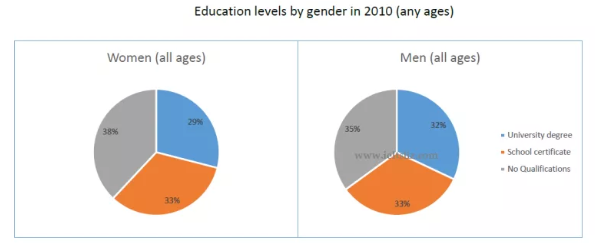
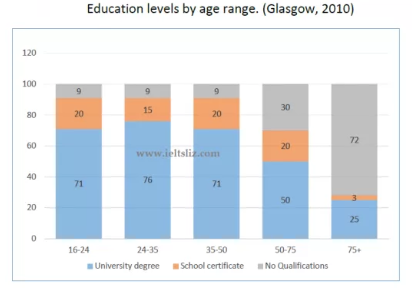
The chart below give information about levels of education in Glasgow, a city in Scotland, in 2010.


Sherk 4 / 7  
Jan 17, 2019   #1

education levels by genders and age range


The bar chart and pie chart illustrates the percentage of education levels by genders and age range in Glasgow, a city in Scotland, in 2010. The information is provided surrounding three different education levels are University Degree, School Certificate and No Qualification.

Overall, the age groups embrace an aggregate of University Degree's education level in the bar chart was primarily colossal of five age items. Furthermore, University Degree has a massive number of majority proportion from 21 to 35 age range (76%). In addition, there is a subtle difference between Scholl Certificate and No Qualification at over 75 age. Slightly more people who were without certificated than men and women have a diploma in school( 72% and 3% respectively).

In terms of School Certificate, out of the five age ranges, in each proportion from 16 to 75 age ranges which have slightly fluctuated 15% and 20% respectively. Moreover, it has corresponded percentage of both genders (33%). Compared to, No Qualification's aged 16 to 50 was one and the same percentage is 9%.

Regarding the pie chart, No Qualification has the highest percentage of educational certification that any genders were achieving with all age.

  • Capture.PNG

  • 1.PNG


Holt  Educational Consultant - / 15393  
Jan 18, 2019   #2
Quoc, the good news is that you wrote the perfect number of words for this report to gain maximum consideration when it comes to individual criteria scoring. The bad news, is that you still have a few grammar issues and presentation concerns in the report. Let's get started with the grammar issues first.

Try to avoid subject verb problems in your presentation by being sure of what action should take place in the sentence and how you will be referring to it. For this essay, since you are presenting information that has already been written, rather than currently being written, then the past form of the word "illustrate" should be used. You must also avoid redundancies just for the sake of meeting or overcompensating for the word count. "One and the same" is a redundancy. Saying "the same" would have been more effective in a formal written presentation.

As for the presentation itself, you should have at least 2 trending statements presented in it. One sentence for the pie chart, one for the bar chart. Presented at the end of the summary overview for maximum scoring effect or, as a stand-alone paragraph immediately after the overview presentation. You should also avoid presenting information within a parenthesis in these report essays as those information are required for formal information on the reader's part. It is not optional. It also prevents you from doing an accurate analysis of the report. Always remember, the assumption is that the reader will not have a copy of these images and data, hence the importance of accurately presenting the information as part of the TI scoring in this essay. Task Information is of vital importance in the smooth presentation of the data from the images to the reader.


Home / Writing Feedback / The chart below give information about levels of education in Glasgow, a city in Scotland, in 2010.
Need Writing or Editing Help?
Fill out one of these forms:

Graduate Writing / Editing:
GraduateWriter form ◳

Best Essay Service:
CustomPapers form ◳

Excellence in Editing:
Rose Editing ◳

AI-Paper Rewriting:
Robot Rewrite ◳

Academic AI Writer:
Custom AI Writer ◳