Unanswered [1] | Urgent [0]
  

Home / Writing Feedback   % width   Posts: 2


The chart illustrates the amount of waste that was disposed and how they changed (2005 - 2008)


drcyyy 1 / -  
Jun 20, 2022   #1

waste disposal in one european country


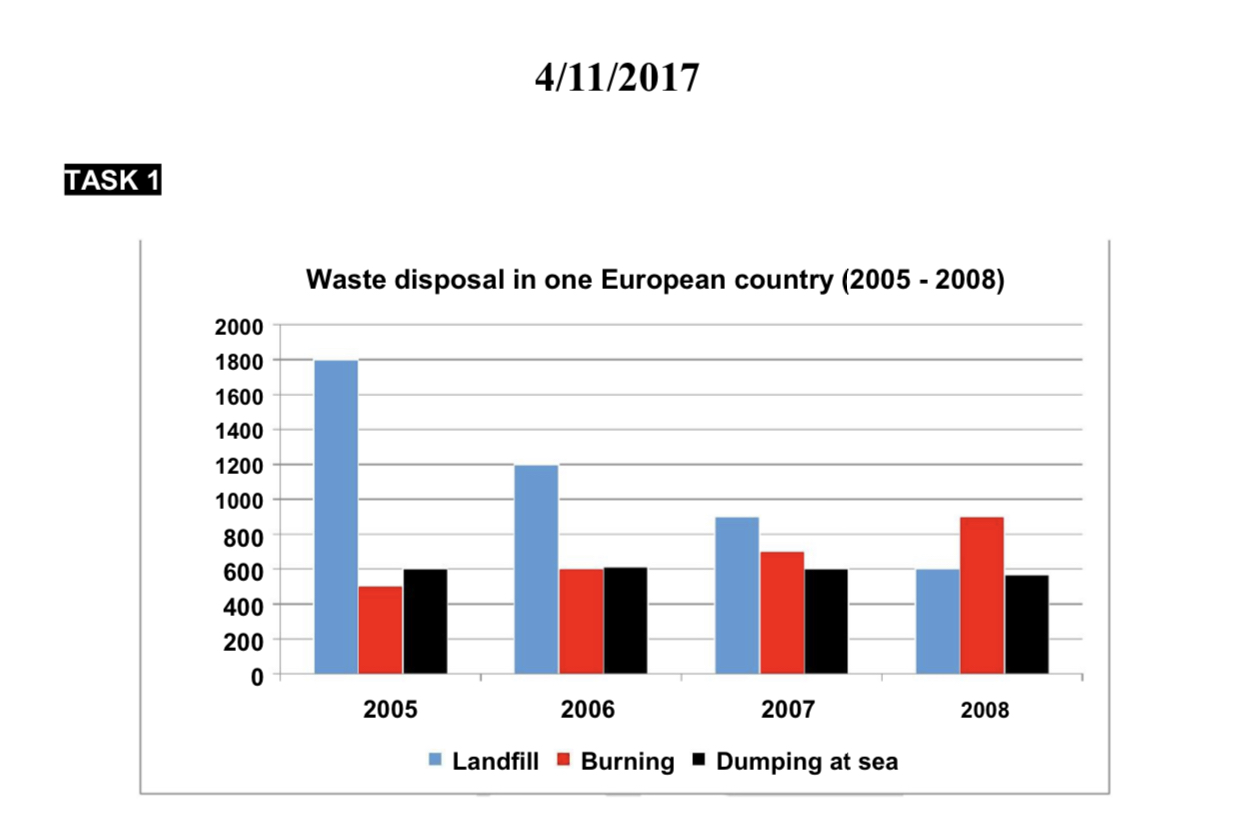
The chart illustrates the amount of waste that was disposed of in landfill, burning, the dumping at sea and how they changed between 2005 and 2008 in a particular European country.

Overall, it can be seen that while landfill was the main reason for waste disposal and burning was the least. However, the trend slowly reversed over the 3 - year period.

The number of poison from landfill started at exactly 1800 million tonnes in 2005, after which it saw a significant decline to precisely 1200 in 2006 and then continued to drop habitually to the north of 900 in 2007 and the final amount was 600 million tonnes in 2008. By contrast, the figure for burners or fuels rose indefectly from just under 500 million tonnes in 2005 to approximately 900 million tonnes after 3 years.

For the level of dumping at sea, it increased slightly from 600 to 650 million tonnes in 2006 before dropping gently to around 550 million tonnes in 2008. This was the only one which remained unchanged through the time.

  • task118.06.PNG


Holt  Educational Consultant - / 15385  
Jun 21, 2022   #2
A clear summary presentation must be composed of individual information sentences. By definition, a sentence is composed of one idea presentation while a paragraph is the cumulative thought presentation of the individual sentences. That is why an academic paragraph is composed of 3-5 sentences each. Inability to present a paragraph in this specific form delivers the idea to the examiner that the writer does not know English writing rules and will result in a failing preliminary TA and GRA score. The writer must work on improving his sentence development skills.

Additional confusion was created by the general image reference. It adds to the confusion of the leader who cannot create a mental picture of the given image since the exact image type is not identified. This added to the task inaccuracy and deductions.

Overall, it can be seen that while landfill was the main reason for waste disposal and burning was the leas

A reasoning sentence was provided but the actual topic or subject was not established. This is further proof on sentence structure unfamiliarity. The with must focus his future exercises on his sentence presentation exercises.


Home / Writing Feedback / The chart illustrates the amount of waste that was disposed and how they changed (2005 - 2008)
Need Writing or Editing Help?
Fill out one of these forms:

Graduate Writing / Editing:
GraduateWriter form ◳

Best Essay Service:
CustomPapers form ◳

Excellence in Editing:
Rose Editing ◳

AI-Paper Rewriting:
Robot Rewrite ◳

Academic AI Writer:
Custom AI Writer ◳