fast food consumption chart
TOPIC:
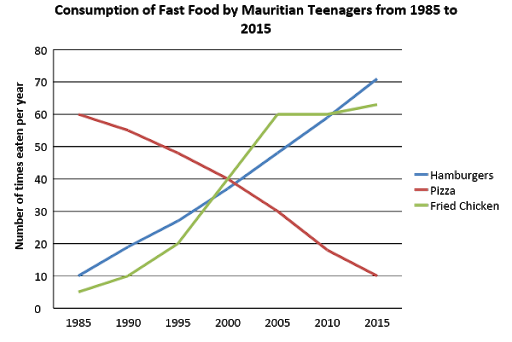
The chart illustrates the consumption of three kinds of fast food by teenagers in Mauritius from 1985 to 2015. Summarise the information by selecting and reporting the main features, and make comparisons where relevant. Write at least 150 words.
MY ANSWER:
The line graph depics three types of fast food which includes hamburgers, pizza and fried chicken consumed by Mauritius teenagers between 1985 to 2015.
Overall, the quantity of teenagers having hamburgers and fried chicken per year showed a significant rise over the period, while the number of pizza eaten experienced a downward trend.
In 1985, teenagers ate hamburgers and Fried chicken approximately 10 and 5 times per year respectively. After an initial increase until 1995, the number of fried chicken eaten increased sharply from 20 to 40 times per year within a decade, exceeding the number of pizza and hamburgers in 2000 and remains steadily after 2005.With a similar trend, the consumption of hamburger increased steadily and reached 70 times per year in 2015. Marked as the most popular fast food.
In contrast, teenagers consumed pizza 60 times per year in 1985. It decreased rapidly throughout the period and end at 10 times per year. The number of pizza eaten was the highest among these three fast food and it ended as the lowest in 2015. It was out traced by both hamburger and Fried Chicken in 2000.

academicwritingtas.png
