Unanswered [3]
  

Home / Writing Feedback   % width   Posts: 4


The chart illustrates the long-term international migration in the United Kingdom


skinnypeter 3 / 6  
Oct 6, 2021   #1

(IELTS TASK 1) INTERNATIONAL MIGRATION IN UK


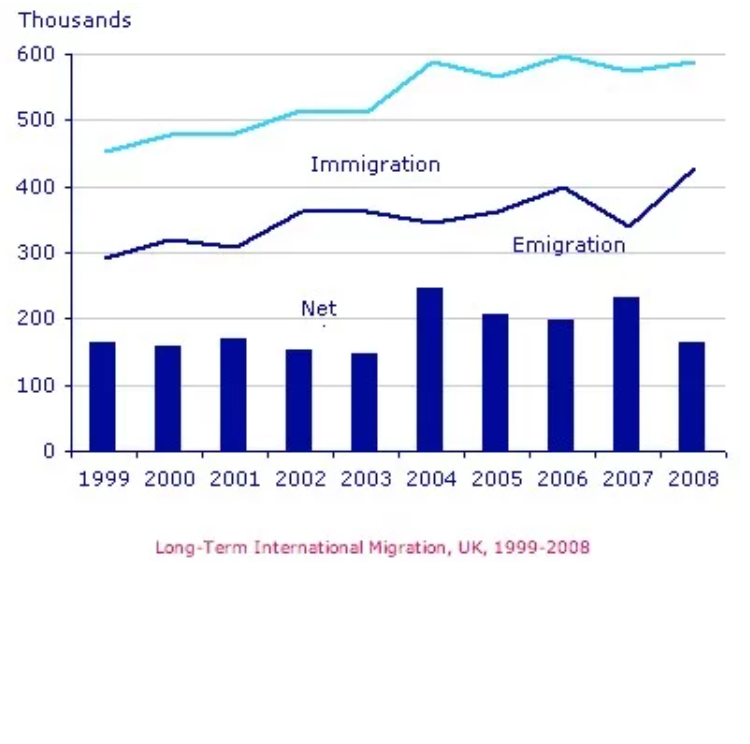
The chart illustrates the rate of immigration, emigration, and net migration in the UK from 1999 to 2008.

Overall, it is clear that UK immigration and emigration experienced a rise over the period shown, but a much higher rate of immigrants in comparison with emigrants. Net migration peaked in 2004 and 2007.

In 1999, the immigration rate was about 450,000 people, while the figures for emigration and net migration registered around 300,000 and 180,000 respectively. From 1999 to 2004, the number of people who immigrated to the UK rose by nearly 150,000 people. However, there was just a small growth in emigration from 300,000 people in 1999 to around 350,000 in 2002 before remaining at a similar level until 2004. Net migration peaked at about 250,000 people in 2004.

After 2004, the immigration rate remained stable until 2008, while emigration saw a significant fluctuation. To clarify, the rate of emigration declined suddenly to over 320,000 people in 2007 before reaching plateau at over 400,000 in 2008. As a result, net migration increased considerably to around 240,000 people in 2007 before falling back to over 150,000 in 2008.

  • Untitled.png


Holt  Educational Consultant - / 15460  
Oct 8, 2021   #2
from 1999 to 2008

You forgot to mention the measurement used as a part of the summary overview. Always include that as this is often highlighted as a part of the image data.

Overall, it is clear that UK immigration and ... in comparison with emigrants.

This is a confusing sequence. pick one of the present or seperate the sentences, ideas to create a trending paragraph instead. Do not use both if you cannot provide a clear reason for it.

Net migration peaked in 2004 and 2007.

This is unnecessary when you are providing 2 trending sentences. Do not over-inform the trend as it gets confusing to understand and will cause grammar range issues for the examiner.

in 2002 before remaining at a similar level until 2004

You need a comma here. It appears that your problem in this essay is with GRA considerations.
gianggiangvn 6 / 11  
Oct 11, 2021   #3
Actually, I love your writing. Clear and concise.

Overall, it is clear that UK ...

You should just write down "... a rise over the period shown. In addition, net migration peaked...
thsi98 1 / 2  
Oct 12, 2021   #4
You might use other ways to express number such as using verb (double, triple), portion (a third, nearly a quarter) or using threefold/fivefold instead of reporting the real data. This might work for comparison/contrasting.


Home / Writing Feedback / The chart illustrates the long-term international migration in the United Kingdom
ⓘ Need Writing or Editing Help?
Fill out one of these forms for professional help:

Best Writing Service:
CustomPapers form ◳

Graduate Writing / Editing:
GraduateWriter form ◳

Excellence in Editing:
Rose Editing ◳

AI-Paper Rewriting:
Robot Rewrite ◳