Unanswered [0]
  

Home / Writing Feedback   % width   Posts: 4


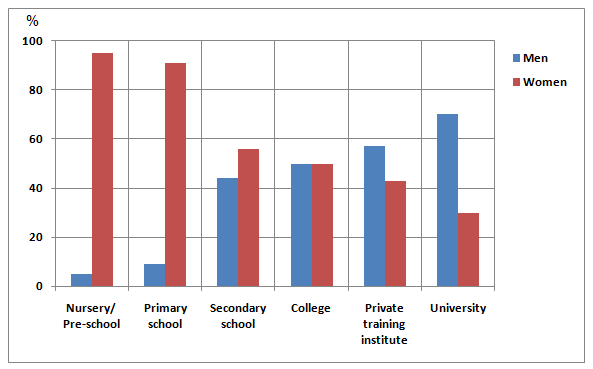
The chart illustrates the proportion male and female tutors in six categories of educational setting


doanhanh5304 1 / -  
Jan 24, 2022   #1

the percentage of male and female teachers in six different types of education


The chart illustrates the proportion male and female tutors in six categories of educational setting in 2010.

Overall,the patterns of Nursey ( pre- school ) and primary school chart have the biggest gap between the figure for male and female. Additional, the most common education setting of female teacher was nursery ( pre-school ) and that of male tutor was university. The percentage of male and female tutors in college was equal.

First of all, nursery ( pre-school ), primary school and secondary school are three types of educational setting that the proportion of female tutors was higher than that of male. The figure for female teachers in nursery ( pre-school ) and primary school, at about 95% and 90% respectively, was significantly higger than that of male tutors, at approximately 5% and 10%. With secondary school , the male tutors' ratio was over 10% lower than the female ones.

Secondly, turning to the educational setting that the proportion of male tutors was higher than that of female teachers ( private training institute and university ), males won in two those types of educational settings, by about 10% and 40% respectively. The percentage of the college teachers, both male and female, were equal, accounting for 50%.

  • barchart1.png


Holt  Educational Consultant - / 15466  
Jan 24, 2022   #2
The writer has gone overboard with his writing. He should not go over 200 words with this essay. It is only a 3, not 4 paragraph essay since there is only 1 image to review and report on. The writer has over stretched what was supposed to be a 175 word report. 175 being the ideal number of words to write in the report to get maximum scoring consideration and also, leave the writer with a pocket of editing time to perfect his presentation in terms of clarity, grammar and punctuation, as well as word spelling and usage corrections.

He also makes a general reference to a chart, when he should have indicated a specific chart type (bar chart) to add to the accuracy of his summarized report. The summary is lacking in shortened information presentation for the benefit of the reader. The writer is leaving the reader with more questions than answers in the summarized presentation.
Ani0506 2 / 2  
Jan 25, 2022   #3
Hi there! If this is the task 1 of IELTS test, then your essay is too long. Also, I think your essay is too general. You should pick 2-3 biggest trends in the graph and explain them in your essay.
phuonganh1752005 2 / 2  
Jan 26, 2022   #4
I think that the you should talk about the general trend of male and female's proprotion in your overview


Home / Writing Feedback / The chart illustrates the proportion male and female tutors in six categories of educational setting
ⓘ Need Writing or Editing Help?
Fill out one of these forms for professional help:

Best Writing Service:
CustomPapers form ◳

Graduate Writing / Editing:
GraduateWriter form ◳

Excellence in Editing:
Rose Editing ◳

AI-Paper Rewriting:
Robot Rewrite ◳