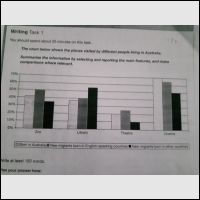
The chart witnessed some places that visited by various people who live in Australia. Overall, it can be seen that, cinema showed the highest percentage among theatre, library and zoo.
Native Australia experienced the largest number entering Movie Theater at 70%, while new immigrants born in English-speaking countries saw five percent lower than it. Then the last placed by new immigrants born in the other countries a half the same category. In library, new migrants born in other countries reached the top number at 55%, then followed by new immigrants born in English-speaking countries (40%) and new migrants born in English speaking countries was a slice below it.
New migrants born in English-speaking countries surprisingly placed the best rank in visiting zoo (50%); however born in Australia in second range forty one percent then the rest type was only thirty five percent. Another category was theater which had minimum percentage almost in the various type of persons. New migrants in English-speaking countries stood at a half of fifty, then followed by other categories below it.

272675_1.jpg
