Unanswered [1]
  

Home / Writing Feedback   % width   Posts: 2


Chart - the percentage of owned and rented accommodations in two regions


Phuongbo 4 / 9  
Mar 17, 2020   #1

households in owned and rented accomodation


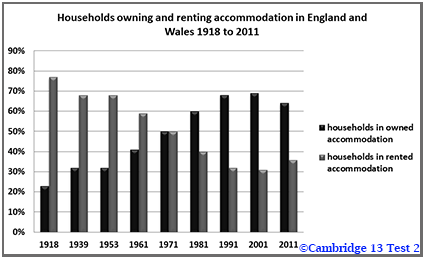
The chart provided compares the percentage of owning accommodation and rented ones in two regions ( England and Wales ) over the course of 93 years from 1918 to 2011. Overall, people were inclined to own a house in the past, while a reverse picture was seen from 1918 to 2011.

In 1918, the percentage of households in rented accommodation held the lion's share ( around 78% ), which was nearly fourfold the percentage of owned accommodation, at 22%. 21 years later, the ratio of rented houses decreased by roughly 9%, while, that of rentals increased by under 10%. Then, they kept that trend and made up the same rate in 1917.

In 1918, the percentage of households owning increased by 10%, which also was the percentage of households renting decreased at the same time. Over the course of 10 years from 1991 to 2001, the percentage of owning accommodation accounted for around 68%, and that of renting accommodation made up nearly 32%. After that, in 2011, the percentage of owning house lost its momentum and dropped to under 65%, while renting accommodation rebounded and held over 45%.

  • 1.png


Holt  Educational Consultant - / 15460  
Mar 17, 2020   #2
You first two paragraphs could use some adjustment in presentation. The clarity and coherence of your information report comes from the way that you are able to separate the information into individual sentences. Do not use run-on presentations, separated only by a comma. Make an effort to write true complex sentences using a period to separate the information presentation. It is important that you learn to present proper complex sentences that join 2 related ideas into one sentence. So for paragraph 1 the combined sentences should be:

- Chart type and measurement type
- Reference to type of data (renter and homeowner) plus their location
- Trending observations

For paragraph 2, you should be using periods to represent adjoining information before moving on to the next bit of information. The same goes for paragraph 3. Basically, the information is all there, it is just the format that became problematic. The presentation format that you chose would have affected your GRA and TA score. It really appears to me that your presentation is mechanical in nature. It doesn't even try to expand on the discussion. It just hits the reader with the information, nothing more. You need to try and provide a proper reference point for your LR, C&C scores as well. So use the correct format for your paragraph presentations. That is the only way to increase your scores in those sections.


Home / Writing Feedback / Chart - the percentage of owned and rented accommodations in two regions
ⓘ Need Writing or Editing Help?
Fill out one of these forms for professional help:

Best Writing Service:
CustomPapers form ◳

Graduate Writing / Editing:
GraduateWriter form ◳

Excellence in Editing:
Rose Editing ◳

AI-Paper Rewriting:
Robot Rewrite ◳