Please check this writing for me. Thank you
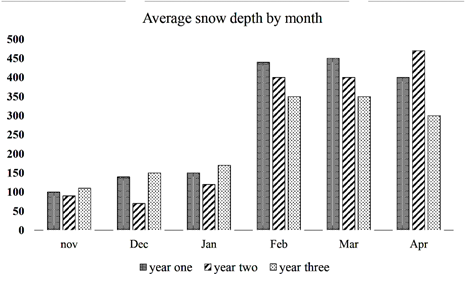
The graph illustrates how deep the snow is in a certain resort developed for skiing in Canada from November to April in three separate years.
As can be seen from the chart, February, March, and April are the months witnessing the highest amount of snow while the remaining three remain below the average of 200cm of snow depth. In addition, the first three months have a similar figure, with year three being the highest, year one the second, and year two the last. A similar downtrend from year one to year three can be seen in February and March.
As for the first three months, both November and January see a steady increase in the snow depth from about 100cm in year one to roughly 150cm in year three whilst that in the second year dropped slightly by about 20cm from 100cm before growing back to more than a 100cm of snow depth.
Regarding the other three months, the amount of snow depth in February and March experiences a similar downward trend from nearly 450cm to about 350cm over the three years. Only the second year in April has a sharp increase in the depth of the snow, going from about 400cm in year one to 450cm before dropping dramatically to a low of 300cm in year three
the thickness of the snow cover near Canadian ski resort
The graph illustrates how deep the snow is in a certain resort developed for skiing in Canada from November to April in three separate years.
As can be seen from the chart, February, March, and April are the months witnessing the highest amount of snow while the remaining three remain below the average of 200cm of snow depth. In addition, the first three months have a similar figure, with year three being the highest, year one the second, and year two the last. A similar downtrend from year one to year three can be seen in February and March.
As for the first three months, both November and January see a steady increase in the snow depth from about 100cm in year one to roughly 150cm in year three whilst that in the second year dropped slightly by about 20cm from 100cm before growing back to more than a 100cm of snow depth.
Regarding the other three months, the amount of snow depth in February and March experiences a similar downward trend from nearly 450cm to about 350cm over the three years. Only the second year in April has a sharp increase in the depth of the snow, going from about 400cm in year one to 450cm before dropping dramatically to a low of 300cm in year three

Picture1.png
