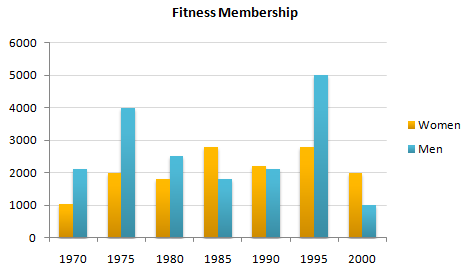
The chart below shows male and female fitness membership between 1970 and 2000
The bar chart reveals the number of fitness club members during 30 years, from 1970 to 2000.
Overall, there are two categories of fitness membership; women and men. Based on the bar chart can be seen that fluctuate number of members between female and male.
First of all, from 1970 to 1975 both categories started from approximately 1000 to over 2000 and the number of members inclined dramatically, with about 2000 women members and doubled number of men members with 4000. Moreover, in the 1980 both categories were a slightly decline and the number of men decreased almost a half of number before, while in the 1985 the number of women who joined the fitness center rose, with over 2500.
As seen, while the number of women fell to 2100 people, the number of men increased to over 2000. In the 1995 the amount of men who attended in the fitness club sat a peak with 5000 people. What is more, in the 2000 there was a slight down over 4 times than period before.

Fitness_memebership..png
