Unanswered [6] | Urgent [0]
  

Home / Writing Feedback   % width   Posts: 3


IELTS WRITING TASK 1 - The chart shows the percentage of women and men in one Asian country who pass


jaynguyen 2 / 2  
Jul 24, 2021   #1

driving test pass rates in asia


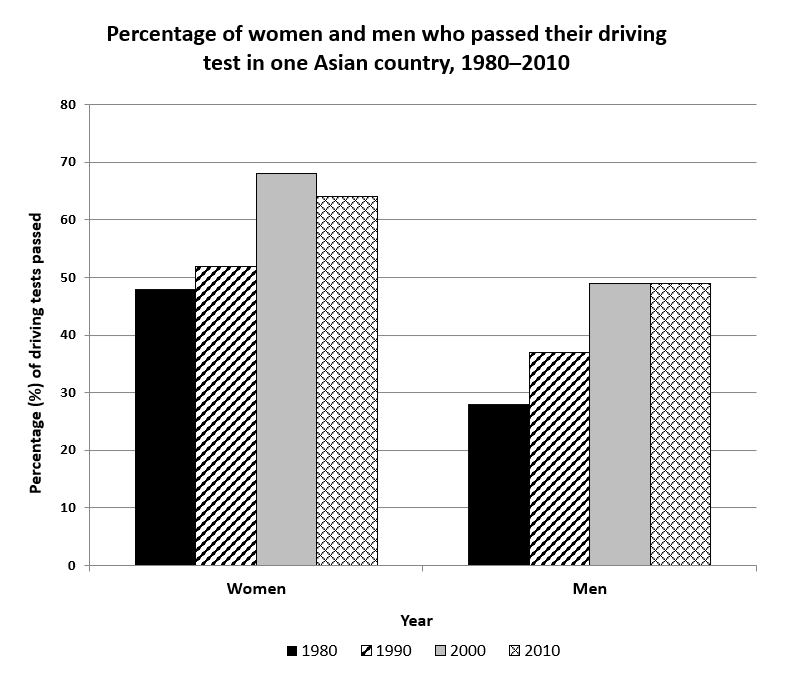
The chart shows the percentage of women and men in one Asian country who passed when they took their driving test between 1980 and 2010.
Summarise the information by selecting and reporting the main features, and make comparisons where relevant.
You should spend about 20 minutes on this task.


The bar graph shows the proportion of each gender who got a driver's license from 1980 to 2010 in one Asian country.
Overall, it is clear that the percentage of women who passed their driving test was higher than that of men over the period of 40 years. In both genders, these figures were low in the first 20 years of the period and increased gradually between 2000 to 2010.

Looking at the graph more closely, one can see that the proportion of women who got driving licenses was lowest in 1980, just nearly 48%. In the next ten years, the number of women who passed the driving test went up moderately by roughly 4%. This figure reached the highest of 68% in 2000 and declined slightly to 65% in 2010.

The similar pattern was seen on the percentage of men who got drive's license between 1980 to 1990. In 1980, the pass driving rate of men was nearly 28% and then this figure grew up by 10% in 1990. Ten years later, the number peaked at nearly 50% and then maintain stability this number to 2010.

  • 3a99ec43c6524c638.png


Holt  Educational Consultant - / 15388  
Jul 25, 2021   #2
As there are now several gender considerations than previously known, it is important that the summary overview be highly specific about this information. Most specially since a clear differentiation of 2 genders was indicated in the actual bar graph image. This is not a matter of being poliiically correct, but a matter of being data accurate when providing information from the image. The trending statement is well developed and presented to be a score increasing part of the summary presentation. There is just a slight error in the year presentation. 1980-2010 is only 3 decades, or a 30 year period. Count the years by groups of 10. The writer indicated a 40 year period. It is an oversight probably caused by to the writer's unfamiliarity with the English langiage or, a miscount on the part part of the writer. Eitherway, it should have been an oversight quickly corrected had a proper review of the draft essay been completed prior to submission.

The paragraphs are completely developed in the sense of a summary presentation. Simple comparisons provided fall within the presentation expectations. The paragraphs are complete and the word count, within acceptable parameteres. The writer did a pretty good job with this presenation. It is clear and concise. Well within the discussion requirements as provided. There is no worry that the the essay will get a failing grade.
OP jaynguyen 2 / 2  
Jul 25, 2021   #3
Well within the discussion requirements as provided. There is no worry that the the essay will get a failing grade.

@Holt
Thank you for your comment, I will try my best to get a good result


Home / Writing Feedback / IELTS WRITING TASK 1 - The chart shows the percentage of women and men in one Asian country who pass
Need Writing or Editing Help?
Fill out one of these forms:

Graduate Writing / Editing:
GraduateWriter form ◳

Best Essay Service:
CustomPapers form ◳

Excellence in Editing:
Rose Editing ◳

AI-Paper Rewriting:
Robot Rewrite ◳

Academic AI Writer:
Custom AI Writer ◳