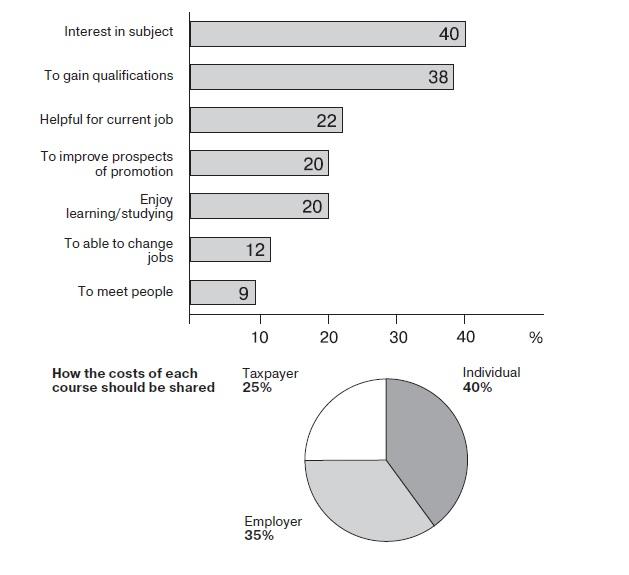
The charts below show the results of a survey of adult education. The first chart shows the reasons why adults decide to study. The pie chart shows how people think the costs of adult education should be shared.
Summary:
The charts give information about results of a survey of adult education. The bar chart illustrates the amount of reasons to study among mature-aged people. The pie chart demonstrates the percentage of tuition fees must be contributed between three different groups. Overall, interest in subject is motivated striking number of adults to study, while the highest proportion of costs of each course is thought should have been paid by individual.
From the bar graph it is clear that interest in subject is surpassed decision to study to gain qualifications by 2%, at 40%. Three other reasons, helpfulness for current job, being able to improve prospects of promotions and enjoyment of learning/studying comprises similar rates at about 20%. The ability to change jobs and meeting people are accepted as least important with 12% and nine percent respectively.
Turning to the pie chart we can easily seen that, a quarter proportion belongs to taxpayer, while individual dominates with 40%. At least the rest of fees are believed should hold by employer.

228910_1_o.jpg
