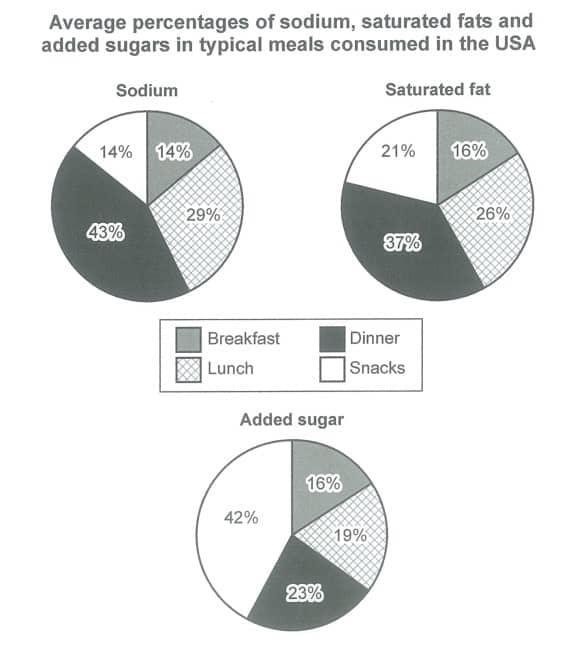
The charts below show the average percentages in typical meals of three types of nutrients, all of which may be unhealthy if eaten too much.
The pie charts display the average percentages of three types of nutrients consumed in different meals particularly in the US.
Overall, the majority of the sodium and saturated fat are been ingested at dinner, whereas most of the added sugar is from snacks. Yet none of the ingredients are consumed beyond 50% in single meal.
It is noticeable that all three nutrients of breakfast constitute the smallest proportion in every pie chart, accounting for 16% in the charts of both saturated fat and added sugar, as well as merely 14% in that of sodium. The sum of sodium from breakfast and snacks is almost the same as of lunch. In contrast, only 19% of added sugar is originated from lunch, which is close to three times lower than the combined ratio of breakfast and snacks. Additionally, people in the US consume 37% of saturated fat at dinner, which is equal to the coalesced percentage of lunch and breakfast.
*The figure is originally from Cambridge IELTS Book 14.
Summarize the information by selecting and reporting the main features, and make comparisons where relevant.
The pie charts display the average percentages of three types of nutrients consumed in different meals particularly in the US.
Overall, the majority of the sodium and saturated fat are been ingested at dinner, whereas most of the added sugar is from snacks. Yet none of the ingredients are consumed beyond 50% in single meal.
It is noticeable that all three nutrients of breakfast constitute the smallest proportion in every pie chart, accounting for 16% in the charts of both saturated fat and added sugar, as well as merely 14% in that of sodium. The sum of sodium from breakfast and snacks is almost the same as of lunch. In contrast, only 19% of added sugar is originated from lunch, which is close to three times lower than the combined ratio of breakfast and snacks. Additionally, people in the US consume 37% of saturated fat at dinner, which is equal to the coalesced percentage of lunch and breakfast.
*The figure is originally from Cambridge IELTS Book 14.

test1task1image.j.jpg
