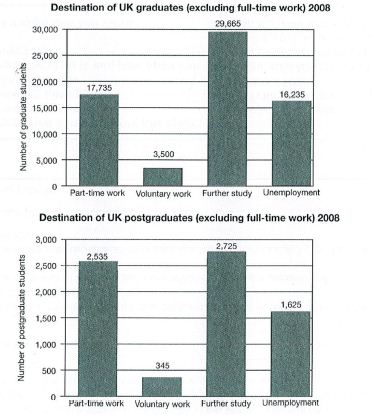
The charts below show what the UK graduate and postgraduate students who did not go into full-time work did after leaving college in 2008. Summarize the information by selecting and reporting the main features, and make comparisons where relevant.
The bar chart illustrates the destinations of British graduate and postgraduate students who did not proceed with a full-time job after leaving college in 2008. They are categorized as part-time work, voluntary work, further study and unemployment. In this essay, I will summarize the features of each category and make comparisons wherever relevant.
Overall, further study came out on top in popularity, followed by part-time work and unemployment, with voluntary work ranking the bottom in the list. Almost the same percentage of graduate and postgraduate students went into unemployment or voluntary work. As to further study, it led part-time work by a considerable margin among graduate students. Yet the difference was slender in the other population group.
Voluntary work was an absolutely unattractive option. Only 3500 graduates and 345 postgraduates proceeded with voluntary work. Part-time work was much more desirable, as it gained favor from 17,735 graduates and 2,535 postgraduates.
All the more so was further study, given the fact that 29,665 postgraduates and 2,725 graduates opted to continue their education. Unemployment was also a common scene in 2008 when 16,235 postgraduates and 1,625 graduates became jobless. With all the information, it is quite evident that the majority of these graduates and postgraduates did not enter labor market.
I would more appreciate it if you score my essay. Now I challenge myself to pursue an 8.
unemployed graduates and postgraduates in britain
The bar chart illustrates the destinations of British graduate and postgraduate students who did not proceed with a full-time job after leaving college in 2008. They are categorized as part-time work, voluntary work, further study and unemployment. In this essay, I will summarize the features of each category and make comparisons wherever relevant.
Overall, further study came out on top in popularity, followed by part-time work and unemployment, with voluntary work ranking the bottom in the list. Almost the same percentage of graduate and postgraduate students went into unemployment or voluntary work. As to further study, it led part-time work by a considerable margin among graduate students. Yet the difference was slender in the other population group.
Voluntary work was an absolutely unattractive option. Only 3500 graduates and 345 postgraduates proceeded with voluntary work. Part-time work was much more desirable, as it gained favor from 17,735 graduates and 2,535 postgraduates.
All the more so was further study, given the fact that 29,665 postgraduates and 2,725 graduates opted to continue their education. Unemployment was also a common scene in 2008 when 16,235 postgraduates and 1,625 graduates became jobless. With all the information, it is quite evident that the majority of these graduates and postgraduates did not enter labor market.
I would more appreciate it if you score my essay. Now I challenge myself to pursue an 8.

Task_1_CB_10_Test_3_.jpg
