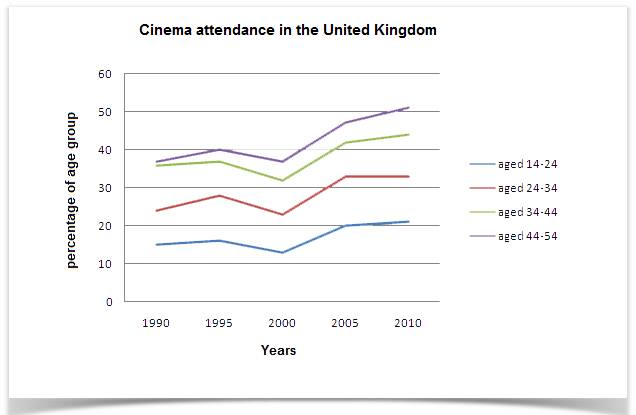
A breakdown of the information about cinema audiences based on the group of age in the Great Britain between 1990 and 2010 is illustrated in the line chart. The data is measured in the proportion of age groups. Overall, it can be generally seen that, amidst some fluctuations, the viewers of all age groups rose from the beginning to the end of the period.
With regards to the age group between 44-45 and 34-44, both of them were the two largest proportions. By the end of the period, they indicated a virtually identical level. 1990 witnessed their similarity, between 37 and 35 percent successively. Then, there was a slight jump in the year of 2000 for them. On the other hand, between 2005 and 2010, the percentage of two age groups experienced a sharp growth in which they covered more than a half percentage for the age of 44-54 and the age of 34-44, at approximately 34%.
Concerning to the rest parts, the age groups between 14-24 and 24-34 had virtually similar trend. The percentage of people viewing movie in the first aspect started at roughly 14 as the tiniest proportion, whereas another was up to 25 percent. From 1995 to 2005 witnessed an identical fluctuation. Eventually, they remained unchanged until the end of the period at nearly 21 and 34 proportion respectively.

12592255_10201329162.jpg
