Unanswered [1]
  

Home / Writing Feedback   % width   Posts: 6


Ielts writing task 1 - a climograph about rainfall and temperature


dieulinh09611 1 / 1  
Jul 24, 2020   #1

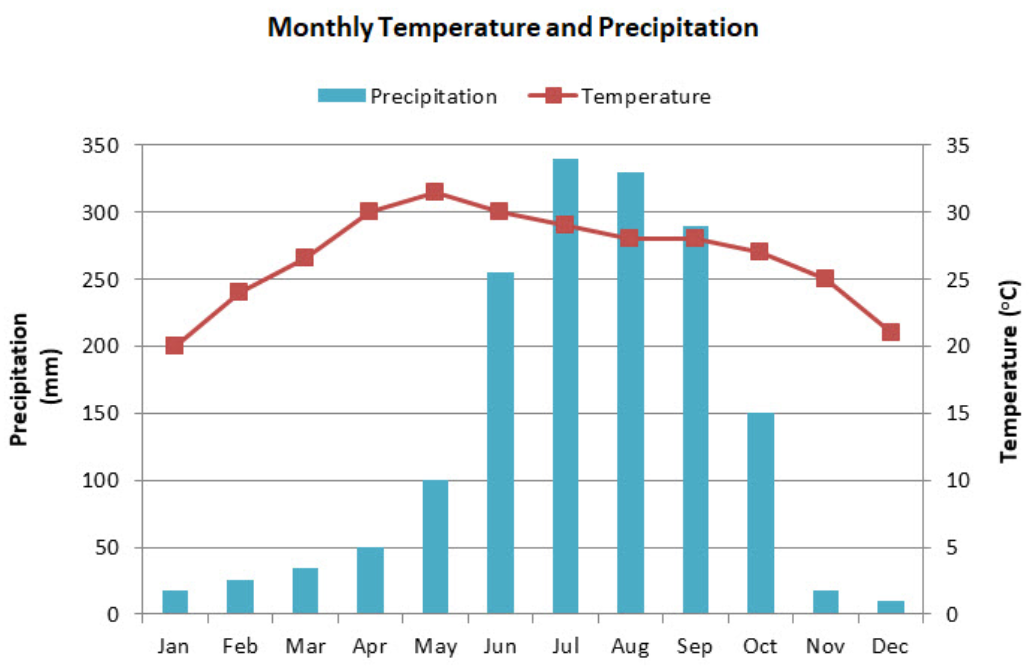
The diagram illustrates the monthly temperature and precipitation in Kolkata city on average within a year.


Overall, both the temperature and the rainfall show the highest figures in the middle of the year, from May to October.

Months in the beginning and end of the year, including January, February, November and December show the lowest average temperature (at around 20 to 25 Celcius degree), as well as the precipitation (at around 10 to 20mm). While the temperature increases significantly and reaches the peak of 32 Celcius degree in May, the rainfall rises more gradually in those 3 months (from March to May), gets the point of 100mm per month on May.

Jun witnesses the most outstanding rise in the precipitation when the figure is 2.5 as much as May (250mm compared to 100mm). The rainfall continues growing in volume and reaches the highest point of around 340mm per month in July while the temperature remains quite constant during those months. Both the temperature and rainfall decline from August to the end of the year, but the precipitation shows the more notable decrease, from 330mm in August to around 5mm in December.

  • Screenshot_1.png


buiquynhhuong 3 / 6  
Jul 24, 2020   #2
Your sentence structure is great.
However, I suppose in this essay, you should not bracket such important content like statistic.
Holt  Educational Consultant - / 15460  
Jul 24, 2020   #3
Quick question, where did you get the reference to Kolkota City? I do not see any reference to a specific city in the graph. Was that part of the discussion instruction? You should have posted the complete instructions for the report presentation so that I could have had a better idea of what information you have to present.

Actually, this isn't a diagram. It is a combination bar and line graph. So you should have indicated it as such in your summary overview. Additionally, you forgot to indicate that the precipitation and temperature are measured in millimeters and celsius respectively. Your summary overview is incommplete due to this missing information.

Where is the comparison discussion for the 3 months when the precipitation and temperature overlapped? What did that mean for the data? Why is it important? Once certain information is highly obvious in the image, you should not forget to mention it in the report. That is a score increasing reference that exam takers often overlook.
OP dieulinh09611 1 / 1  
Jul 24, 2020   #4
@Holt
Sorry for the infomation missing, the name of the city was mentioned in the topic.

I discussed over those 3 months (Aug-Oct) in the last paragraph and I don't think that there is a need to mention those figures are overlapped.

Thank you very much for your comment regarding to my task, it helps a lot.

@buiquynhhuong
Thank you very much for your comment, I appreciate that.
BAOBAO 1 / 2  
Jul 27, 2020   #5
@dieulinh09611
hi, i have some advice for you

u should use wide range of sentence structures like "between ..and" instead of just using "from .. to" many times

u should use range of linking devices to connect the writing (I see u don't use much linking verb in a paragraph and between 2 paragraphs)
Dolly Doloris 1 / 2  
Aug 1, 2020   #6
Coherence&cohesion seems less valued,it might be better if you add linking words into the essay.
Good work on the writing,carry on.


Home / Writing Feedback / Ielts writing task 1 - a climograph about rainfall and temperature
ⓘ Need Writing or Editing Help?
Fill out one of these forms for professional help:

Best Writing Service:
CustomPapers form ◳

Graduate Writing / Editing:
GraduateWriter form ◳

Excellence in Editing:
Rose Editing ◳

AI-Paper Rewriting:
Robot Rewrite ◳