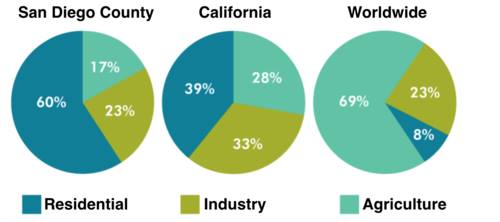
The graph illustrates the consumption 3 types water used (residential, industry, and agriculture) in 3 regions. The figures are compared to amounts of water used in San Diego, California, and worldwide.
As an overall trend, the two regions showed different water consumption from the worldwide average, while residential has the largest in San Diego and California. Agriculture has the largest consumption in the worldwide.
In particular, residential consumption was the highest in San Diego, accounting for 60%, which followed by industry at 23% or nearly a quarter, and agriculture at 17%.
Likewise, California used residential in the largest proportion of 39%. Industry showed a third of figure. Agriculture was used at 28%.
In the worldwide, both residential and industry were used the least in this period with percentages of 8% and 23% respectively. Agriculture used in the worldwide showed the largest proportion, nearly seven in tens of all consumption, or accounting for 69%.

essay32809.jpg
