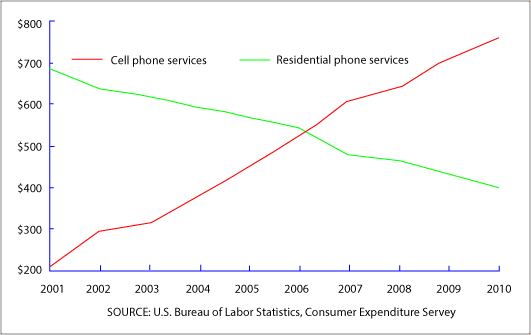
IELTS TASK 1: Line graph: Average annual expenditures on cell phone and residential phone services
This is my first time for doing writing task 1. Please check my mistake and could you tell me how many mark can I score ? Thank you so much
The graph illustrates comparision between average yearly costs on cell phone and residential phone services from 2001 to 2010. It can be seen from the graph, yearly expenditures on cell phone service steadily decreased during the period while annual costs of residential phone services increased gradually.
In 2001, yearly expenditure on cell phone service stood at approximately 700$ and remained a consistent decrease to around 500$ in 2006. By contrast, residential phone services were spent at over 200$ in 2000 before rising significantly to 550$ by 2006. In 2006, there was a remarkable point when the amount of money for both residential phone and cell phone services equalized.
During 4 years period from 2006 to 2010, there was a considerable opposition between costs of residential phone and cell phone services. In comparision to the amount of money spent for residential phone services, which saw an plummet to over 400$, expenditures on cell phone rose dramatically to a peak of around 750$ at the same time.
166 words

13428012_17296994672.png
