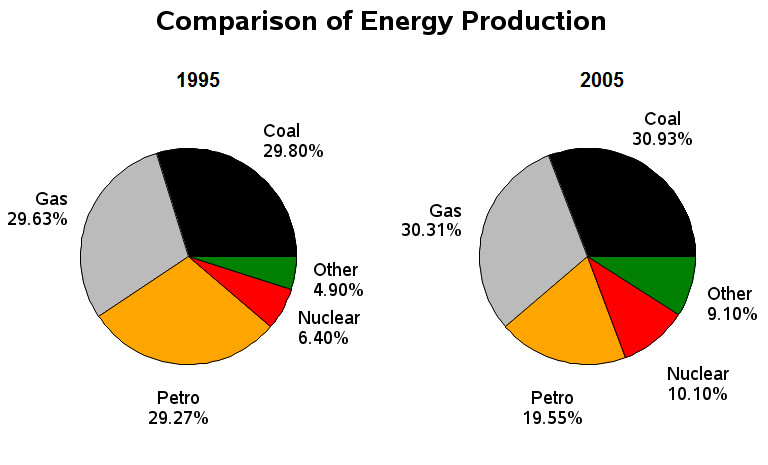
The picture described the differences of energy output happened in 1995 and 2005. Overall, it can be seen that generally the use of coal and gas witnessed the most dominant for energy production among other different resources.
In 1995 and 2005, coal and gas still showed the highest percentage, while the other items significantly changed. However, coal presented slightly on the peak compare to the gas; it was reaching 30.93% and 30.30% respectively. In contrast, there significantly decreased of petro number rather it had been produced in numerous ranges before. In addition, the proportion of petro production illustrated virtually the same figure with coal and gas in 1995, but it dramatically decreased in 19.55% over the subsequent ten years.
Less change was seen in the remaining two aspects, nuclear and other. In 1995, the production of nuclear experienced minimum number at 6.40%, but it went up over ten percent in ten years later. Besides, the same treatment also happened with output of other sector which had risen by roughly 6%.

ieltspiechartcomp.png
