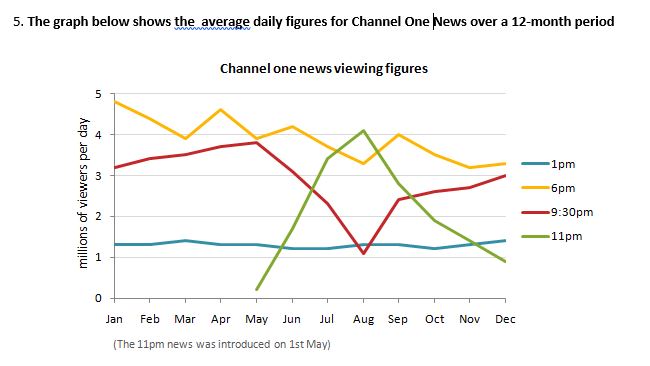
A comparison of hourly viewers in millions per day of Channel One News in one year is illustrated in the line chart. Overall, all data showed fluctuation trend except 1 pm that was looked stable in one year. It also can be seen that 6 pm has the highest number of average viewers while although in general 1 pm placed as the lowest, but in the end of the year, 11 pm became the lowest.
It is clear that in the first five months the sequence still same until the appearance of 11 pm news on 1st May. There are many changes of order in August, that was proven by a significant increase of 11 pm into the peak just above four, decreasing of 6 pm to the middle of 3 and four, and a downward movement of 9.30 into a little above one.
After that, these three data had immediately change in the next following months. There is a raise of 6 pm news into 4 and next it went down until November and rose slightly above three in the last month. A moderate change also showed by 9.30 from 2.5 to 3. In contrast, there was a tremendous negative change of 11 pm program into about 25 percent smaller than in august. Then, 1 pm program still in the same trend, just above 1.

piechart3OMG.JPG
