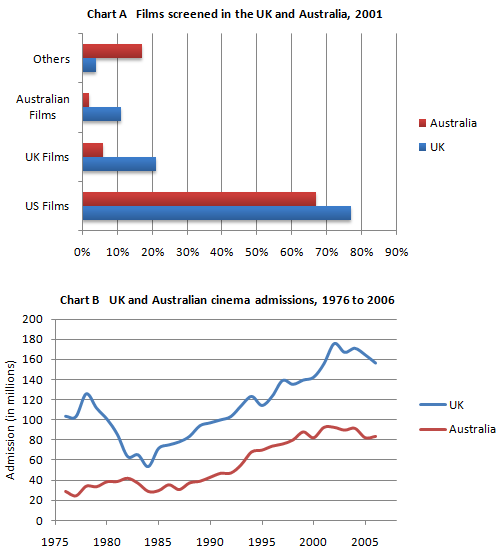
The bar chart illustrates the number of film watched in England and Australia in 2001, categorized by US, UK Australian films and others; the line graph describes movie theater entry for thirty years. Overall, the majority films showed in both UK and Australia were US films, while England and Canberra witnessed the highest number in selling ticket in 2005.
US films considerably presented higher rate than others in both country. It represented more than 75% in UK and ten percent below of UK figure in Australia. Next, UK movies reached almost a fifth percent in UK, but less than ten percent screened in Canberra. The Australian films experienced the minority among all categories in its own country. The last category was other films was watched about 17% in Australia and screened five percent in UK.In 2005, UK and Australia showed the highest spectators for cinema, followed by 180 and 100 millions. However, UK and Australia had the same pattern from 1975 to 2005.
US films considerably presented higher rate than others in both country. It represented more than 75% in UK and ten percent below of UK figure in Australia. Next, UK movies reached almost a fifth percent in UK, but less than ten percent screened in Canberra. The Australian films experienced the minority among all categories in its own country. The last category was other films was watched about 17% in Australia and screened five percent in UK.In 2005, UK and Australia showed the highest spectators for cinema, followed by 180 and 100 millions. However, UK and Australia had the same pattern from 1975 to 2005.

Line_graph_n_Bar_Cha.png
