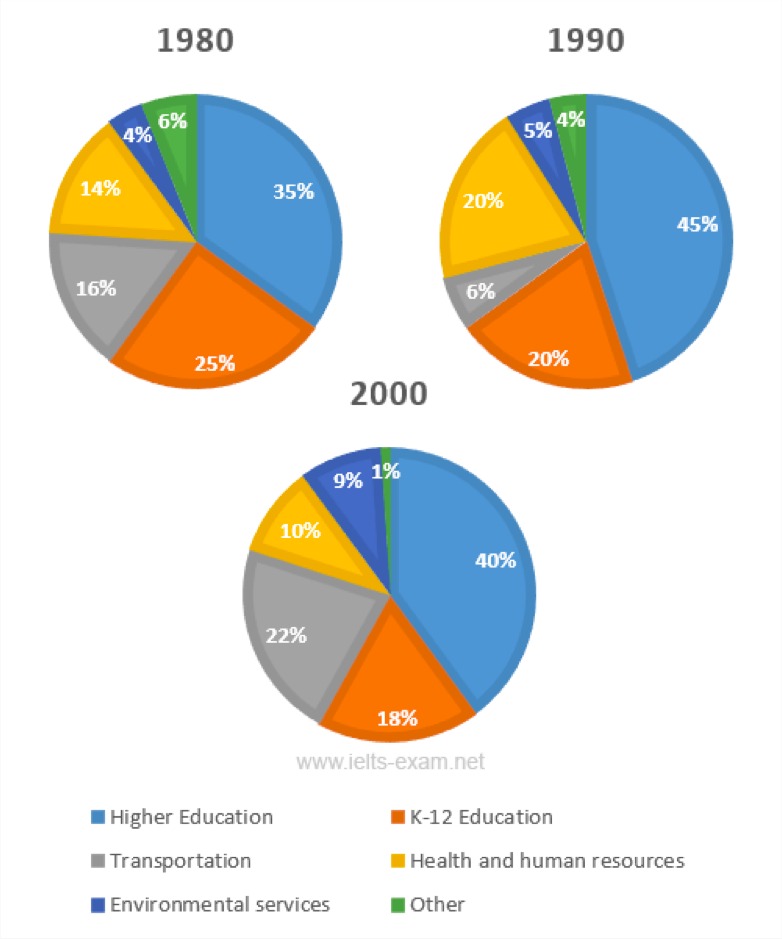
The three pie charts below show the changes in annual spending by local authorities in Someland in 1980, 1990 and 2000
The provided charts illustrate about the comparison of local government expenditure in each category in Someland. The measurement is percentage. In general trend, there were categories which experienced fluctuation of annual spending. Meanwhile, feature which dominated was higher education. According to the data, there were majority proportion and minority proportion which will be explained in this following essay.
To begin, there were majority data such as higher education, transportation and K-12 education in three decades. Higher education witnessed a fluctuation over a three-decade. Meanwhile, K-12 education decreased slowly by 7 percent in 3 periods. However, government spending in transportation also fluctuated.
On the other hand, there were also minority figure from each feature because the percentage was below 20 percent such as environmental services, health and human resources and other. A more detail, look at the graph reveals that the proportion of health and human resources in annual spending fluctuated. Then, the proportion of environmental services in annual outgoings continuous and steady rose. Last feature, other, fell steeply in three decades.
spendings fluctuation
The provided charts illustrate about the comparison of local government expenditure in each category in Someland. The measurement is percentage. In general trend, there were categories which experienced fluctuation of annual spending. Meanwhile, feature which dominated was higher education. According to the data, there were majority proportion and minority proportion which will be explained in this following essay.
To begin, there were majority data such as higher education, transportation and K-12 education in three decades. Higher education witnessed a fluctuation over a three-decade. Meanwhile, K-12 education decreased slowly by 7 percent in 3 periods. However, government spending in transportation also fluctuated.
On the other hand, there were also minority figure from each feature because the percentage was below 20 percent such as environmental services, health and human resources and other. A more detail, look at the graph reveals that the proportion of health and human resources in annual spending fluctuated. Then, the proportion of environmental services in annual outgoings continuous and steady rose. Last feature, other, fell steeply in three decades.

17555180_10207409409.jpg
