Question :
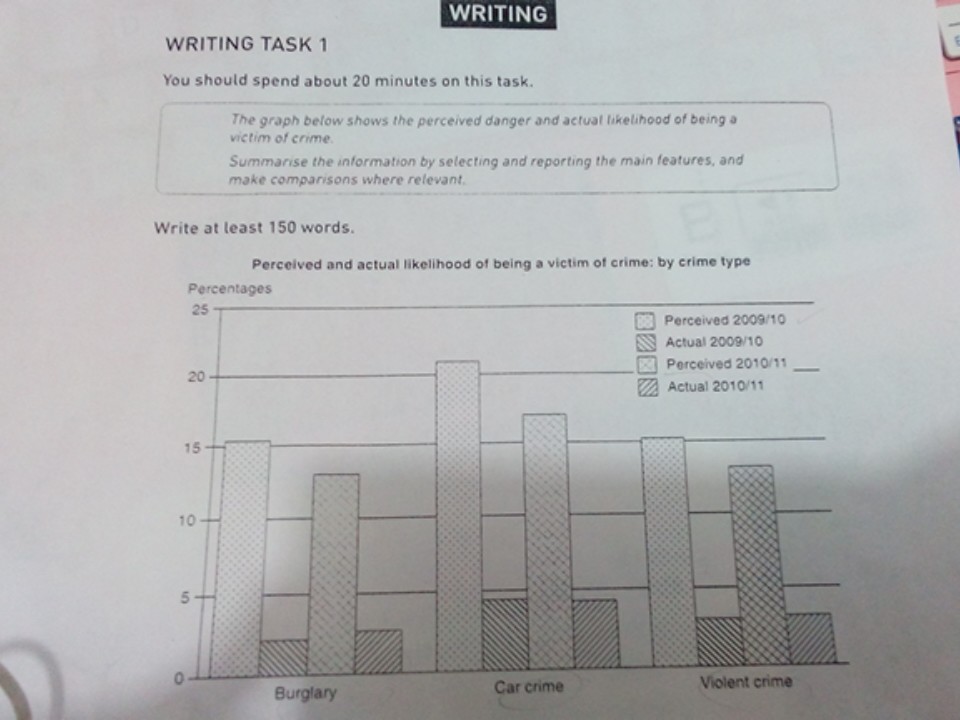
The graph below shows the perceived danger and actual likelihood of being a victim of crime. Summarise the information by selecting and reporting the main features and make comparisons where relevant.
Answer :
A comparison of percentage of people's sense towards crime and actual likelihood to be a victim of crime is shown in this bar graph for 2009 to 2010.
Overall, more people fear of being a victim of offense but the reality was not as frightening as they assume. By far the highest proportion of crime type was car crime.
People's perception towards crime decreased in each type of crime. The feeling danger of Bulgary and Violent crime had slightly changed in 2009 and same proportion in 2010. Anxiety of being car crime victims become a peak to 21 % in 2009 and 18 % in 2010.
Actually, crime was not as daunting as their arguments. A little increased of Bulgary and Violent crime occurred between 2009 and 2010 while car crime contrast with the others. Percentage of actual likelihood of being a victim of crime was 4 % in 2009 and 3.5 % in 2010.

IMG_20160604_164643..jpg
